Immigrants from Belize vs Swedish Median Family Income
COMPARE
Immigrants from Belize
Swedish
Median Family Income
Median Family Income Comparison
Immigrants from Belize
Swedes
$89,197
MEDIAN FAMILY INCOME
0.1/ 100
METRIC RATING
279th/ 347
METRIC RANK
$108,499
MEDIAN FAMILY INCOME
95.1/ 100
METRIC RATING
115th/ 347
METRIC RANK
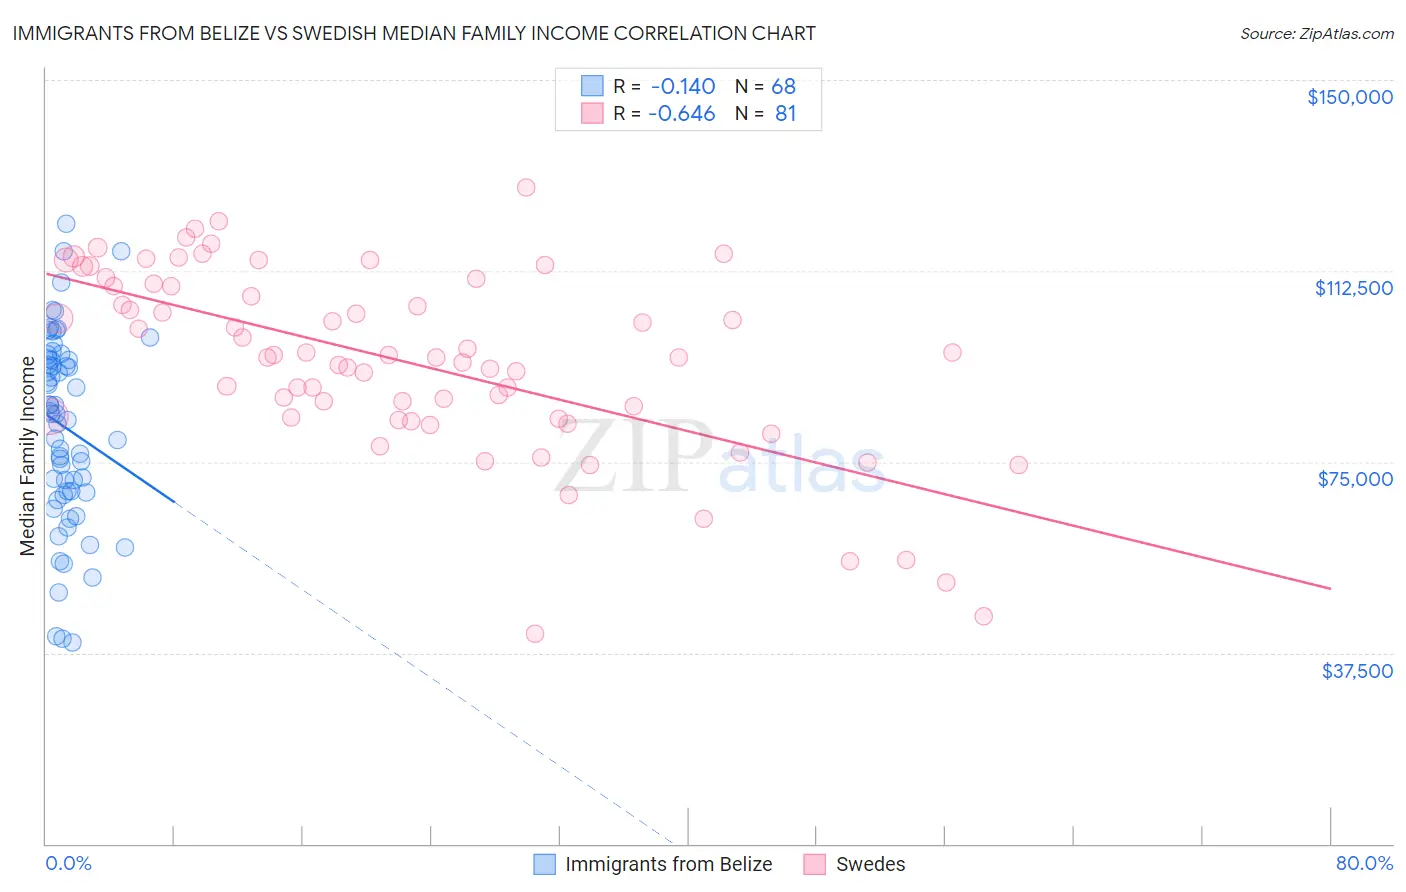
Immigrants from Belize vs Swedish Median Family Income Correlation Chart
The statistical analysis conducted on geographies consisting of 130,266,359 people shows a poor negative correlation between the proportion of Immigrants from Belize and median family income in the United States with a correlation coefficient (R) of -0.140 and weighted average of $89,197. Similarly, the statistical analysis conducted on geographies consisting of 538,326,829 people shows a significant negative correlation between the proportion of Swedes and median family income in the United States with a correlation coefficient (R) of -0.646 and weighted average of $108,499, a difference of 21.6%.
Median Family Income Correlation Summary
| Measurement | Immigrants from Belize | Swedish |
| Minimum | $39,621 | $41,250 |
| Maximum | $121,707 | $128,899 |
| Range | $82,086 | $87,649 |
| Mean | $81,787 | $94,659 |
| Median | $84,449 | $95,565 |
| Interquartile 25% (IQ1) | $69,088 | $83,510 |
| Interquartile 75% (IQ3) | $95,112 | $109,800 |
| Interquartile Range (IQR) | $26,023 | $26,290 |
| Standard Deviation (Sample) | $18,723 | $18,382 |
| Standard Deviation (Population) | $18,585 | $18,268 |
Similar Demographics by Median Family Income
Demographics Similar to Immigrants from Belize by Median Family Income
In terms of median family income, the demographic groups most similar to Immigrants from Belize are Immigrants from Grenada ($89,249, a difference of 0.060%), Immigrants from Jamaica ($89,268, a difference of 0.080%), Immigrants from Zaire ($89,285, a difference of 0.10%), British West Indian ($88,987, a difference of 0.24%), and Blackfeet ($88,717, a difference of 0.54%).
| Demographics | Rating | Rank | Median Family Income |
| Immigrants | Liberia | 0.2 /100 | #272 | Tragic $90,450 |
| Immigrants | Micronesia | 0.2 /100 | #273 | Tragic $90,345 |
| Spanish Americans | 0.2 /100 | #274 | Tragic $90,322 |
| Immigrants | St. Vincent and the Grenadines | 0.2 /100 | #275 | Tragic $90,094 |
| Immigrants | Zaire | 0.1 /100 | #276 | Tragic $89,285 |
| Immigrants | Jamaica | 0.1 /100 | #277 | Tragic $89,268 |
| Immigrants | Grenada | 0.1 /100 | #278 | Tragic $89,249 |
| Immigrants | Belize | 0.1 /100 | #279 | Tragic $89,197 |
| British West Indians | 0.1 /100 | #280 | Tragic $88,987 |
| Blackfeet | 0.1 /100 | #281 | Tragic $88,717 |
| Comanche | 0.1 /100 | #282 | Tragic $88,556 |
| Bangladeshis | 0.1 /100 | #283 | Tragic $88,358 |
| Indonesians | 0.1 /100 | #284 | Tragic $88,301 |
| Guatemalans | 0.1 /100 | #285 | Tragic $88,295 |
| Immigrants | Nicaragua | 0.1 /100 | #286 | Tragic $88,267 |
Demographics Similar to Swedes by Median Family Income
In terms of median family income, the demographic groups most similar to Swedes are Polish ($108,507, a difference of 0.010%), Immigrants from Saudi Arabia ($108,544, a difference of 0.040%), Chilean ($108,429, a difference of 0.060%), Immigrants from Poland ($108,570, a difference of 0.070%), and Immigrants from Western Asia ($108,691, a difference of 0.18%).
| Demographics | Rating | Rank | Median Family Income |
| Immigrants | Zimbabwe | 95.9 /100 | #108 | Exceptional $108,830 |
| Immigrants | Afghanistan | 95.6 /100 | #109 | Exceptional $108,709 |
| British | 95.6 /100 | #110 | Exceptional $108,705 |
| Immigrants | Western Asia | 95.6 /100 | #111 | Exceptional $108,691 |
| Immigrants | Poland | 95.3 /100 | #112 | Exceptional $108,570 |
| Immigrants | Saudi Arabia | 95.2 /100 | #113 | Exceptional $108,544 |
| Poles | 95.2 /100 | #114 | Exceptional $108,507 |
| Swedes | 95.1 /100 | #115 | Exceptional $108,499 |
| Chileans | 95.0 /100 | #116 | Exceptional $108,429 |
| Immigrants | Philippines | 94.6 /100 | #117 | Exceptional $108,288 |
| Ethiopians | 94.5 /100 | #118 | Exceptional $108,251 |
| Sri Lankans | 94.5 /100 | #119 | Exceptional $108,234 |
| Immigrants | Northern Africa | 94.3 /100 | #120 | Exceptional $108,161 |
| Europeans | 94.1 /100 | #121 | Exceptional $108,099 |
| Immigrants | Jordan | 92.9 /100 | #122 | Exceptional $107,715 |