Immigrants from Oceania vs Swedish Median Family Income
COMPARE
Immigrants from Oceania
Swedish
Median Family Income
Median Family Income Comparison
Immigrants from Oceania
Swedes
$106,453
MEDIAN FAMILY INCOME
87.3/ 100
METRIC RATING
134th/ 347
METRIC RANK
$108,499
MEDIAN FAMILY INCOME
95.1/ 100
METRIC RATING
115th/ 347
METRIC RANK
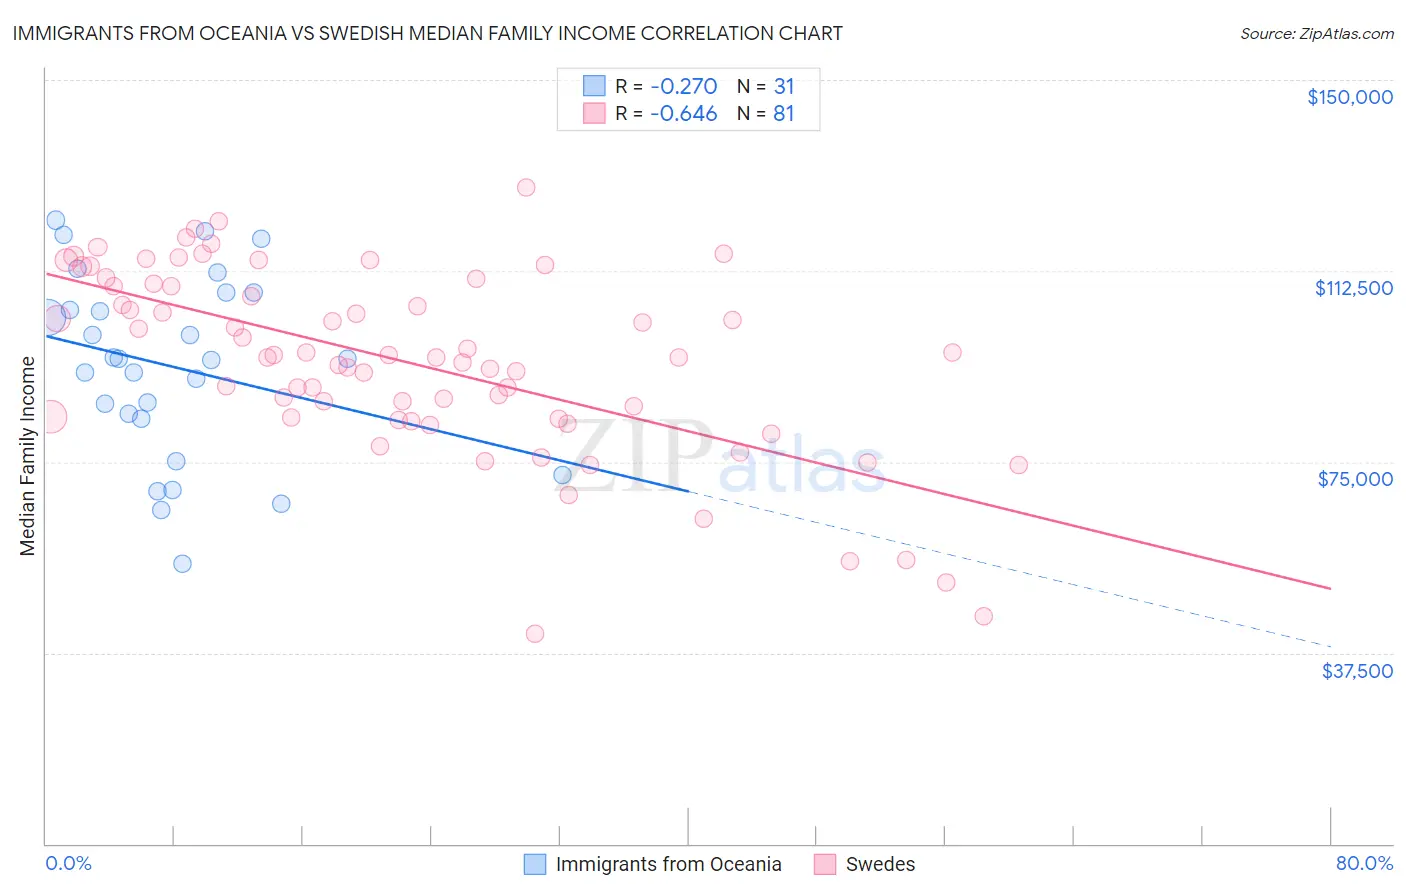
Immigrants from Oceania vs Swedish Median Family Income Correlation Chart
The statistical analysis conducted on geographies consisting of 305,332,408 people shows a weak negative correlation between the proportion of Immigrants from Oceania and median family income in the United States with a correlation coefficient (R) of -0.270 and weighted average of $106,453. Similarly, the statistical analysis conducted on geographies consisting of 538,326,829 people shows a significant negative correlation between the proportion of Swedes and median family income in the United States with a correlation coefficient (R) of -0.646 and weighted average of $108,499, a difference of 1.9%.
Median Family Income Correlation Summary
| Measurement | Immigrants from Oceania | Swedish |
| Minimum | $55,035 | $41,250 |
| Maximum | $122,501 | $128,899 |
| Range | $67,465 | $87,649 |
| Mean | $93,799 | $94,659 |
| Median | $95,302 | $95,565 |
| Interquartile 25% (IQ1) | $83,518 | $83,510 |
| Interquartile 75% (IQ3) | $108,312 | $109,800 |
| Interquartile Range (IQR) | $24,794 | $26,290 |
| Standard Deviation (Sample) | $17,988 | $18,382 |
| Standard Deviation (Population) | $17,696 | $18,268 |
Demographics Similar to Immigrants from Oceania and Swedes by Median Family Income
In terms of median family income, the demographic groups most similar to Immigrants from Oceania are Ugandan ($106,541, a difference of 0.080%), Immigrants from Fiji ($106,544, a difference of 0.090%), Canadian ($106,597, a difference of 0.14%), Brazilian ($106,942, a difference of 0.46%), and Arab ($106,952, a difference of 0.47%). Similarly, the demographic groups most similar to Swedes are Polish ($108,507, a difference of 0.010%), Chilean ($108,429, a difference of 0.060%), Immigrants from Philippines ($108,288, a difference of 0.19%), Ethiopian ($108,251, a difference of 0.23%), and Sri Lankan ($108,234, a difference of 0.24%).
| Demographics | Rating | Rank | Median Family Income |
| Poles | 95.2 /100 | #114 | Exceptional $108,507 |
| Swedes | 95.1 /100 | #115 | Exceptional $108,499 |
| Chileans | 95.0 /100 | #116 | Exceptional $108,429 |
| Immigrants | Philippines | 94.6 /100 | #117 | Exceptional $108,288 |
| Ethiopians | 94.5 /100 | #118 | Exceptional $108,251 |
| Sri Lankans | 94.5 /100 | #119 | Exceptional $108,234 |
| Immigrants | Northern Africa | 94.3 /100 | #120 | Exceptional $108,161 |
| Europeans | 94.1 /100 | #121 | Exceptional $108,099 |
| Immigrants | Jordan | 92.9 /100 | #122 | Exceptional $107,715 |
| Carpatho Rusyns | 92.2 /100 | #123 | Exceptional $107,502 |
| Pakistanis | 91.7 /100 | #124 | Exceptional $107,390 |
| Taiwanese | 91.4 /100 | #125 | Exceptional $107,295 |
| Serbians | 90.8 /100 | #126 | Exceptional $107,157 |
| Lebanese | 90.5 /100 | #127 | Exceptional $107,086 |
| Immigrants | Ethiopia | 90.0 /100 | #128 | Excellent $106,969 |
| Arabs | 89.9 /100 | #129 | Excellent $106,952 |
| Brazilians | 89.8 /100 | #130 | Excellent $106,942 |
| Canadians | 88.1 /100 | #131 | Excellent $106,597 |
| Immigrants | Fiji | 87.8 /100 | #132 | Excellent $106,544 |
| Ugandans | 87.8 /100 | #133 | Excellent $106,541 |
| Immigrants | Oceania | 87.3 /100 | #134 | Excellent $106,453 |