Immigrants from Barbados vs Swedish Median Family Income
COMPARE
Immigrants from Barbados
Swedish
Median Family Income
Median Family Income Comparison
Immigrants from Barbados
Swedes
$92,419
MEDIAN FAMILY INCOME
0.5/ 100
METRIC RATING
254th/ 347
METRIC RANK
$108,499
MEDIAN FAMILY INCOME
95.1/ 100
METRIC RATING
115th/ 347
METRIC RANK
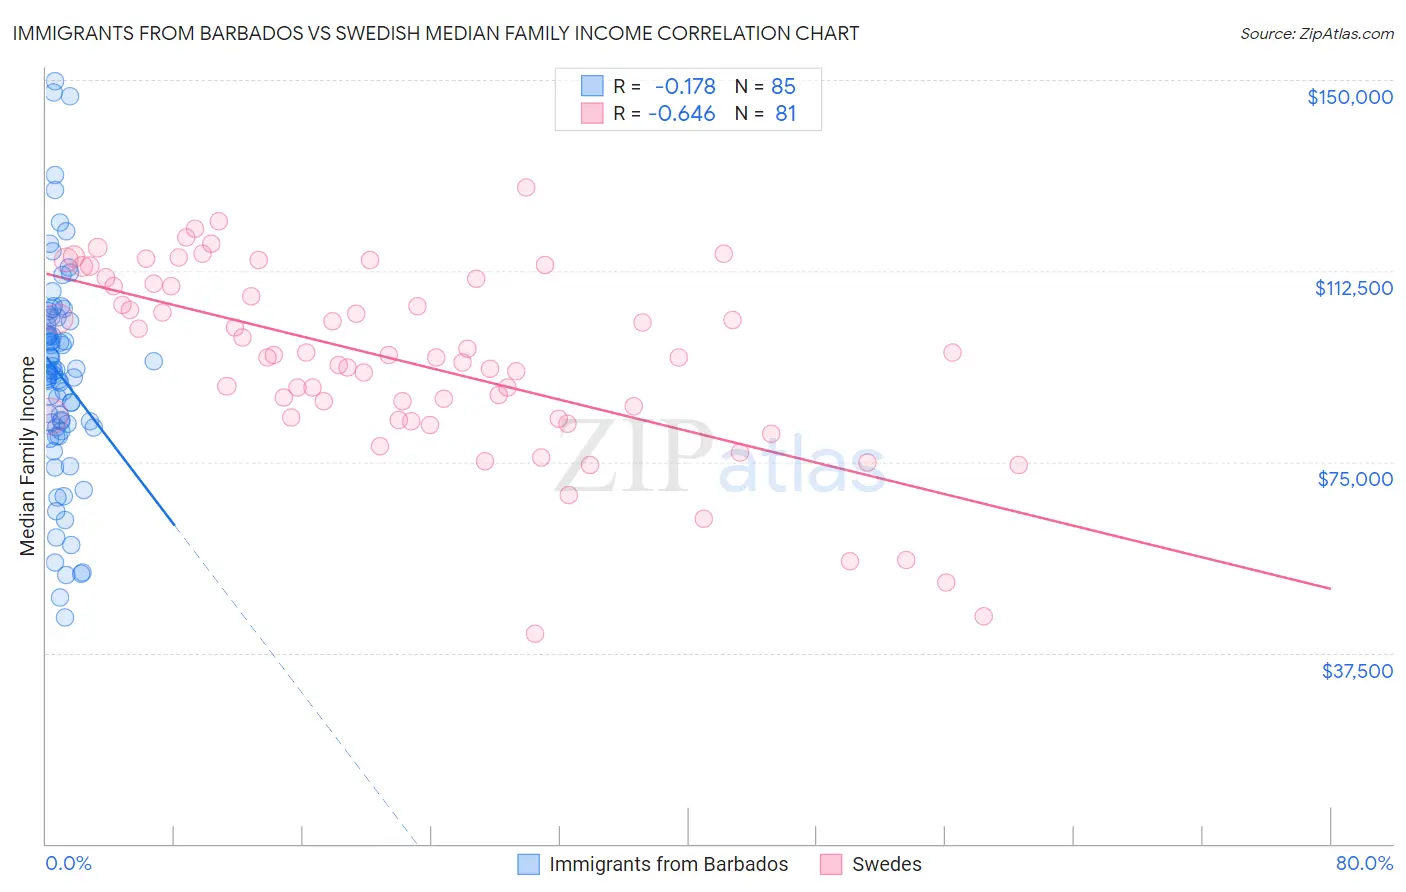
Immigrants from Barbados vs Swedish Median Family Income Correlation Chart
The statistical analysis conducted on geographies consisting of 112,740,718 people shows a poor negative correlation between the proportion of Immigrants from Barbados and median family income in the United States with a correlation coefficient (R) of -0.178 and weighted average of $92,419. Similarly, the statistical analysis conducted on geographies consisting of 538,326,829 people shows a significant negative correlation between the proportion of Swedes and median family income in the United States with a correlation coefficient (R) of -0.646 and weighted average of $108,499, a difference of 17.4%.
Median Family Income Correlation Summary
| Measurement | Immigrants from Barbados | Swedish |
| Minimum | $44,554 | $41,250 |
| Maximum | $149,653 | $128,899 |
| Range | $105,099 | $87,649 |
| Mean | $92,071 | $94,659 |
| Median | $92,856 | $95,565 |
| Interquartile 25% (IQ1) | $81,708 | $83,510 |
| Interquartile 75% (IQ3) | $103,000 | $109,800 |
| Interquartile Range (IQR) | $21,293 | $26,290 |
| Standard Deviation (Sample) | $20,843 | $18,382 |
| Standard Deviation (Population) | $20,721 | $18,268 |
Similar Demographics by Median Family Income
Demographics Similar to Immigrants from Barbados by Median Family Income
In terms of median family income, the demographic groups most similar to Immigrants from Barbados are Immigrants from Guyana ($92,513, a difference of 0.10%), Immigrants from El Salvador ($92,545, a difference of 0.14%), Immigrants from Laos ($92,239, a difference of 0.20%), Nicaraguan ($92,231, a difference of 0.20%), and Immigrants from Somalia ($92,609, a difference of 0.21%).
| Demographics | Rating | Rank | Median Family Income |
| Immigrants | Senegal | 0.7 /100 | #247 | Tragic $92,912 |
| French American Indians | 0.7 /100 | #248 | Tragic $92,872 |
| Immigrants | Ecuador | 0.7 /100 | #249 | Tragic $92,837 |
| West Indians | 0.6 /100 | #250 | Tragic $92,765 |
| Immigrants | Somalia | 0.6 /100 | #251 | Tragic $92,609 |
| Immigrants | El Salvador | 0.6 /100 | #252 | Tragic $92,545 |
| Immigrants | Guyana | 0.6 /100 | #253 | Tragic $92,513 |
| Immigrants | Barbados | 0.5 /100 | #254 | Tragic $92,419 |
| Immigrants | Laos | 0.5 /100 | #255 | Tragic $92,239 |
| Nicaraguans | 0.5 /100 | #256 | Tragic $92,231 |
| Americans | 0.4 /100 | #257 | Tragic $92,096 |
| Osage | 0.4 /100 | #258 | Tragic $91,926 |
| Cape Verdeans | 0.4 /100 | #259 | Tragic $91,848 |
| Pennsylvania Germans | 0.4 /100 | #260 | Tragic $91,763 |
| Inupiat | 0.4 /100 | #261 | Tragic $91,730 |
Demographics Similar to Swedes by Median Family Income
In terms of median family income, the demographic groups most similar to Swedes are Polish ($108,507, a difference of 0.010%), Immigrants from Saudi Arabia ($108,544, a difference of 0.040%), Chilean ($108,429, a difference of 0.060%), Immigrants from Poland ($108,570, a difference of 0.070%), and Immigrants from Western Asia ($108,691, a difference of 0.18%).
| Demographics | Rating | Rank | Median Family Income |
| Immigrants | Zimbabwe | 95.9 /100 | #108 | Exceptional $108,830 |
| Immigrants | Afghanistan | 95.6 /100 | #109 | Exceptional $108,709 |
| British | 95.6 /100 | #110 | Exceptional $108,705 |
| Immigrants | Western Asia | 95.6 /100 | #111 | Exceptional $108,691 |
| Immigrants | Poland | 95.3 /100 | #112 | Exceptional $108,570 |
| Immigrants | Saudi Arabia | 95.2 /100 | #113 | Exceptional $108,544 |
| Poles | 95.2 /100 | #114 | Exceptional $108,507 |
| Swedes | 95.1 /100 | #115 | Exceptional $108,499 |
| Chileans | 95.0 /100 | #116 | Exceptional $108,429 |
| Immigrants | Philippines | 94.6 /100 | #117 | Exceptional $108,288 |
| Ethiopians | 94.5 /100 | #118 | Exceptional $108,251 |
| Sri Lankans | 94.5 /100 | #119 | Exceptional $108,234 |
| Immigrants | Northern Africa | 94.3 /100 | #120 | Exceptional $108,161 |
| Europeans | 94.1 /100 | #121 | Exceptional $108,099 |
| Immigrants | Jordan | 92.9 /100 | #122 | Exceptional $107,715 |