Immigrants from Belize vs Swedish Cognitive Disability
COMPARE
Immigrants from Belize
Swedish
Cognitive Disability
Cognitive Disability Comparison
Immigrants from Belize
Swedes
17.9%
COGNITIVE DISABILITY
0.5/ 100
METRIC RATING
260th/ 347
METRIC RANK
16.5%
COGNITIVE DISABILITY
99.8/ 100
METRIC RATING
53rd/ 347
METRIC RANK
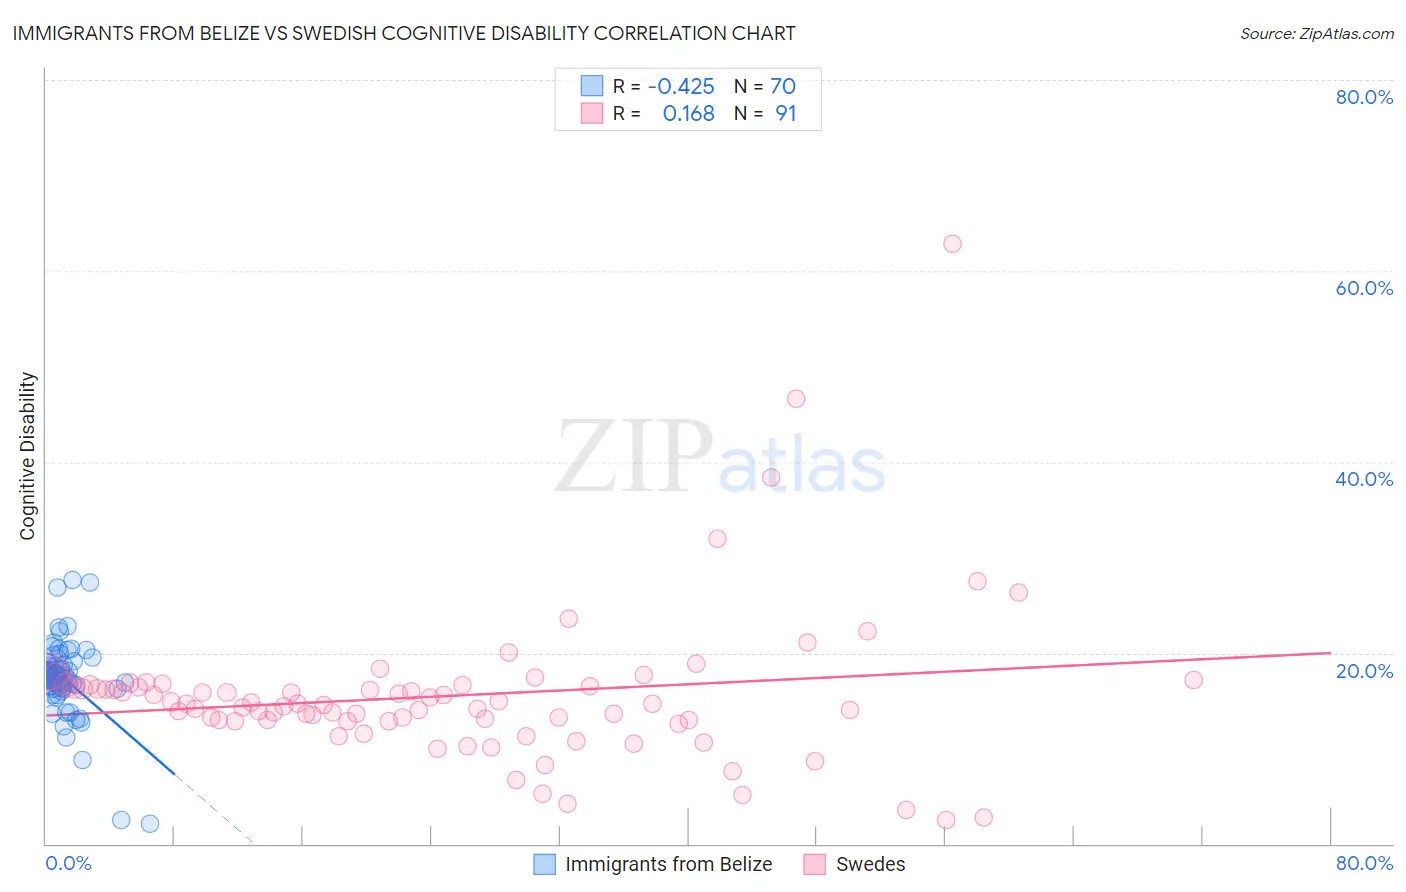
Immigrants from Belize vs Swedish Cognitive Disability Correlation Chart
The statistical analysis conducted on geographies consisting of 130,294,835 people shows a moderate negative correlation between the proportion of Immigrants from Belize and percentage of population with cognitive disability in the United States with a correlation coefficient (R) of -0.425 and weighted average of 17.9%. Similarly, the statistical analysis conducted on geographies consisting of 539,118,311 people shows a poor positive correlation between the proportion of Swedes and percentage of population with cognitive disability in the United States with a correlation coefficient (R) of 0.168 and weighted average of 16.5%, a difference of 8.5%.
Cognitive Disability Correlation Summary
| Measurement | Immigrants from Belize | Swedish |
| Minimum | 2.1% | 2.5% |
| Maximum | 27.6% | 62.8% |
| Range | 25.5% | 60.2% |
| Mean | 17.3% | 15.5% |
| Median | 17.3% | 14.6% |
| Interquartile 25% (IQ1) | 16.3% | 12.9% |
| Interquartile 75% (IQ3) | 18.7% | 16.6% |
| Interquartile Range (IQR) | 2.4% | 3.7% |
| Standard Deviation (Sample) | 4.1% | 8.1% |
| Standard Deviation (Population) | 4.1% | 8.0% |
Similar Demographics by Cognitive Disability
Demographics Similar to Immigrants from Belize by Cognitive Disability
In terms of cognitive disability, the demographic groups most similar to Immigrants from Belize are Ethiopian (17.9%, a difference of 0.010%), Guamanian/Chamorro (17.9%, a difference of 0.050%), Sierra Leonean (17.9%, a difference of 0.080%), Immigrants from Armenia (17.9%, a difference of 0.090%), and Mexican American Indian (17.9%, a difference of 0.10%).
| Demographics | Rating | Rank | Cognitive Disability |
| Hopi | 0.6 /100 | #253 | Tragic 17.9% |
| Hispanics or Latinos | 0.6 /100 | #254 | Tragic 17.9% |
| Immigrants | Azores | 0.6 /100 | #255 | Tragic 17.9% |
| Bahamians | 0.6 /100 | #256 | Tragic 17.9% |
| Mexican American Indians | 0.6 /100 | #257 | Tragic 17.9% |
| Immigrants | Armenia | 0.6 /100 | #258 | Tragic 17.9% |
| Ethiopians | 0.5 /100 | #259 | Tragic 17.9% |
| Immigrants | Belize | 0.5 /100 | #260 | Tragic 17.9% |
| Guamanians/Chamorros | 0.5 /100 | #261 | Tragic 17.9% |
| Sierra Leoneans | 0.4 /100 | #262 | Tragic 17.9% |
| Immigrants | Barbados | 0.4 /100 | #263 | Tragic 17.9% |
| Menominee | 0.4 /100 | #264 | Tragic 18.0% |
| Spanish Americans | 0.4 /100 | #265 | Tragic 18.0% |
| Belizeans | 0.4 /100 | #266 | Tragic 18.0% |
| Nepalese | 0.3 /100 | #267 | Tragic 18.0% |
Demographics Similar to Swedes by Cognitive Disability
In terms of cognitive disability, the demographic groups most similar to Swedes are Immigrants from Iran (16.5%, a difference of 0.040%), Soviet Union (16.5%, a difference of 0.060%), Immigrants from Korea (16.5%, a difference of 0.10%), Immigrants from Venezuela (16.5%, a difference of 0.13%), and Iranian (16.5%, a difference of 0.15%).
| Demographics | Rating | Rank | Cognitive Disability |
| Immigrants | Colombia | 99.8 /100 | #46 | Exceptional 16.5% |
| Immigrants | Italy | 99.8 /100 | #47 | Exceptional 16.5% |
| Immigrants | North America | 99.8 /100 | #48 | Exceptional 16.5% |
| Iranians | 99.8 /100 | #49 | Exceptional 16.5% |
| Norwegians | 99.8 /100 | #50 | Exceptional 16.5% |
| Immigrants | Korea | 99.8 /100 | #51 | Exceptional 16.5% |
| Soviet Union | 99.8 /100 | #52 | Exceptional 16.5% |
| Swedes | 99.8 /100 | #53 | Exceptional 16.5% |
| Immigrants | Iran | 99.8 /100 | #54 | Exceptional 16.5% |
| Immigrants | Venezuela | 99.7 /100 | #55 | Exceptional 16.5% |
| Austrians | 99.7 /100 | #56 | Exceptional 16.6% |
| Bhutanese | 99.7 /100 | #57 | Exceptional 16.6% |
| Pennsylvania Germans | 99.7 /100 | #58 | Exceptional 16.6% |
| Immigrants | Peru | 99.7 /100 | #59 | Exceptional 16.6% |
| Romanians | 99.7 /100 | #60 | Exceptional 16.6% |