Immigrants from Belize vs Assyrian/Chaldean/Syriac Median Family Income

COMPARE

Immigrants from Belize
Race
Ancestry
AfghanAfricanAlaska NativeAlaskan AthabascanAlbanianAleutAlsatianAmericanApacheArabArapahoArgentineanArmenianAustralianAustrianBahamianBangladeshiBarbadianBasqueBelgianBelizeanBermudanBhutaneseBlackfeetBolivianBrazilianBritishBritish West IndianBulgarianBurmeseCajunCambodianCanadianCape VerdeanCarpatho RusynCelticCentral AmericanCentral American IndianCherokeeCheyenneChickasawChileanChineseChippewaChoctawColombianColvilleComancheCosta RicanCreeCreekCroatianCrowCubanCypriotCzechCzechoslovakianDanishDelawareDominicanDutchDutch West IndianEastern EuropeanEcuadorianEgyptianEnglishEstonianEthiopianEuropeanFijianFilipinoFinnishFrenchFrench American IndianFrench CanadianGermanGerman RussianGhanaianGreekGuamanian/ChamorroGuatemalanGuyaneseHaitianHmongHonduranHopiHoumaHungarianIcelanderIndian (Asian)IndonesianInupiatIranianIraqiIrishIroquoisIsraeliItalianJamaicanJapaneseJordanianKenyanKiowaKoreanLaotianLatvianLebaneseLiberianLithuanianLumbeeLuxembourgerMacedonianMalaysianMalteseMarshalleseMenomineeMexicanMexican American IndianMongolianMoroccanNative HawaiianNavajoNepaleseNew ZealanderNicaraguanNigerianNorthern EuropeanNorwegianOkinawanOsageOttawaPaiutePakistaniPalestinianPanamanianParaguayanPennsylvania GermanPeruvianPimaPolishPortuguesePotawatomiPuebloPuerto RicanPuget Sound SalishRomanianRussianSalvadoranSamoanScandinavianScotch-IrishScottishSeminoleSenegaleseSerbianShoshoneSierra LeoneanSiouxSlavicSlovakSloveneSomaliSouth AfricanSouth AmericanSouth American IndianSoviet UnionSpaniardSpanishSpanish AmericanSpanish American IndianSri LankanSubsaharan AfricanSudaneseSwedishSwissSyrianTaiwaneseThaiTlingit-HaidaTohono O'OdhamTonganTrinidadian and TobagonianTsimshianTurkishU.S. Virgin IslanderUgandanUkrainianUruguayanUteVenezuelanVietnameseWelshWest IndianYakamaYaquiYugoslavianYumanYup'ikZimbabwean
Immigration
NonimmigrantsImmigrantsAfghanistanAfricaAlbaniaArgentinaArmeniaAsiaAustraliaAustriaBahamasBangladeshBarbadosBelarusBelgiumBelizeBoliviaBosnia and HerzegovinaBrazilBulgariaBurma/MyanmarCabo VerdeCambodiaCameroonCanadaCaribbeanCentral AmericaChileChinaColombiaCongoCosta RicaCroatiaCubaCzechoslovakiaDenmarkDominicaDominican RepublicEastern AfricaEastern AsiaEastern EuropeEcuadorEgyptEl SalvadorEnglandEritreaEthiopiaEuropeFijiFranceGermanyGhanaGreeceGrenadaGuatemalaGuyanaHaitiHondurasHong KongHungaryIndiaIndonesiaIranIraqIrelandIsraelItalyJamaicaJapanJordanKazakhstanKenyaKoreaKuwaitLaosLatin AmericaLatviaLebanonLiberiaLithuaniaMalaysiaMexicoMicronesiaMiddle AfricaMoldovaMoroccoNepalNetherlandsNicaraguaNigeriaNorth AmericaNorth MacedoniaNorthern AfricaNorthern EuropeNorwayOceaniaPakistanPanamaPeruPhilippinesPolandPortugalRomaniaRussiaSaudi ArabiaScotlandSenegalSerbiaSierra LeoneSingaporeSomaliaSouth AfricaSouth AmericaSouth Central AsiaSouth Eastern AsiaSouthern EuropeSpainSri LankaSt. Vincent and the GrenadinesSudanSwedenSwitzerlandSyriaTaiwanThailandTrinidad and TobagoTurkeyUgandaUkraineUruguayUzbekistanVenezuelaVietnamWest IndiesWestern AfricaWestern AsiaWestern EuropeYemenZaireZimbabweAzores
Assyrian/Chaldean/Syriac
Race
Ancestry
AfghanAfricanAlaska NativeAlaskan AthabascanAlbanianAleutAlsatianAmericanApacheArabArapahoArgentineanArmenianAssyrian/Chaldean/SyriacAustralianAustrianBahamianBangladeshiBarbadianBasqueBelgianBelizeanBermudanBhutaneseBlackfeetBolivianBrazilianBritishBritish West IndianBulgarianBurmeseCajunCambodianCanadianCape VerdeanCarpatho RusynCelticCentral AmericanCentral American IndianCherokeeCheyenneChickasawChileanChineseChippewaChoctawColombianColvilleComancheCosta RicanCreeCreekCroatianCrowCubanCypriotCzechCzechoslovakianDanishDelawareDominicanDutchDutch West IndianEastern EuropeanEcuadorianEgyptianEnglishEstonianEthiopianEuropeanFijianFilipinoFinnishFrenchFrench American IndianFrench CanadianGermanGerman RussianGhanaianGreekGuamanian/ChamorroGuatemalanGuyaneseHaitianHmongHonduranHopiHoumaHungarianIcelanderIndian (Asian)IndonesianInupiatIranianIraqiIrishIroquoisIsraeliItalianJamaicanJapaneseJordanianKenyanKiowaKoreanLaotianLatvianLebaneseLiberianLithuanianLumbeeLuxembourgerMacedonianMalaysianMalteseMarshalleseMenomineeMexicanMexican American IndianMongolianMoroccanNative HawaiianNavajoNepaleseNew ZealanderNicaraguanNigerianNorthern EuropeanNorwegianOkinawanOsageOttawaPaiutePakistaniPalestinianPanamanianParaguayanPennsylvania GermanPeruvianPimaPolishPortuguesePotawatomiPuebloPuerto RicanPuget Sound SalishRomanianRussianSalvadoranSamoanScandinavianScotch-IrishScottishSeminoleSenegaleseSerbianShoshoneSierra LeoneanSiouxSlavicSlovakSloveneSomaliSouth AfricanSouth AmericanSouth American IndianSoviet UnionSpaniardSpanishSpanish AmericanSpanish American IndianSri LankanSubsaharan AfricanSudaneseSwedishSwissSyrianTaiwaneseThaiTlingit-HaidaTohono O'OdhamTonganTrinidadian and TobagonianTsimshianTurkishU.S. Virgin IslanderUgandanUkrainianUruguayanUteVenezuelanVietnameseWelshWest IndianYakamaYaquiYugoslavianYumanYup'ikZimbabwean
Immigration
NonimmigrantsImmigrantsAfghanistanAfricaAlbaniaArgentinaArmeniaAsiaAustraliaAustriaBahamasBangladeshBarbadosBelarusBelgiumBoliviaBosnia and HerzegovinaBrazilBulgariaBurma/MyanmarCabo VerdeCambodiaCameroonCanadaCaribbeanCentral AmericaChileChinaColombiaCongoCosta RicaCroatiaCubaCzechoslovakiaDenmarkDominicaDominican RepublicEastern AfricaEastern AsiaEastern EuropeEcuadorEgyptEl SalvadorEnglandEritreaEthiopiaEuropeFijiFranceGermanyGhanaGreeceGrenadaGuatemalaGuyanaHaitiHondurasHong KongHungaryIndiaIndonesiaIranIraqIrelandIsraelItalyJamaicaJapanJordanKazakhstanKenyaKoreaKuwaitLaosLatin AmericaLatviaLebanonLiberiaLithuaniaMalaysiaMexicoMicronesiaMiddle AfricaMoldovaMoroccoNepalNetherlandsNicaraguaNigeriaNorth AmericaNorth MacedoniaNorthern AfricaNorthern EuropeNorwayOceaniaPakistanPanamaPeruPhilippinesPolandPortugalRomaniaRussiaSaudi ArabiaScotlandSenegalSerbiaSierra LeoneSingaporeSomaliaSouth AfricaSouth AmericaSouth Central AsiaSouth Eastern AsiaSouthern EuropeSpainSri LankaSt. Vincent and the GrenadinesSudanSwedenSwitzerlandSyriaTaiwanThailandTrinidad and TobagoTurkeyUgandaUkraineUruguayUzbekistanVenezuelaVietnamWest IndiesWestern AfricaWestern AsiaWestern EuropeYemenZaireZimbabweAzores
Median Family Income
Income
Poverty
Unemployment
Labor Participation
Family Structure
Vehicle Availability
Education Level
Disability

Median Family Income Comparison

Immigrants from Belize

Assyrians/Chaldeans/Syriacs

Tragic
Exceptional
$89,197
MEDIAN FAMILY INCOME
0.1/ 100
METRIC RATING
279th/ 347
METRIC RANK
$109,622
MEDIAN FAMILY INCOME
97.2/ 100
METRIC RATING
102nd/ 347
METRIC RANK

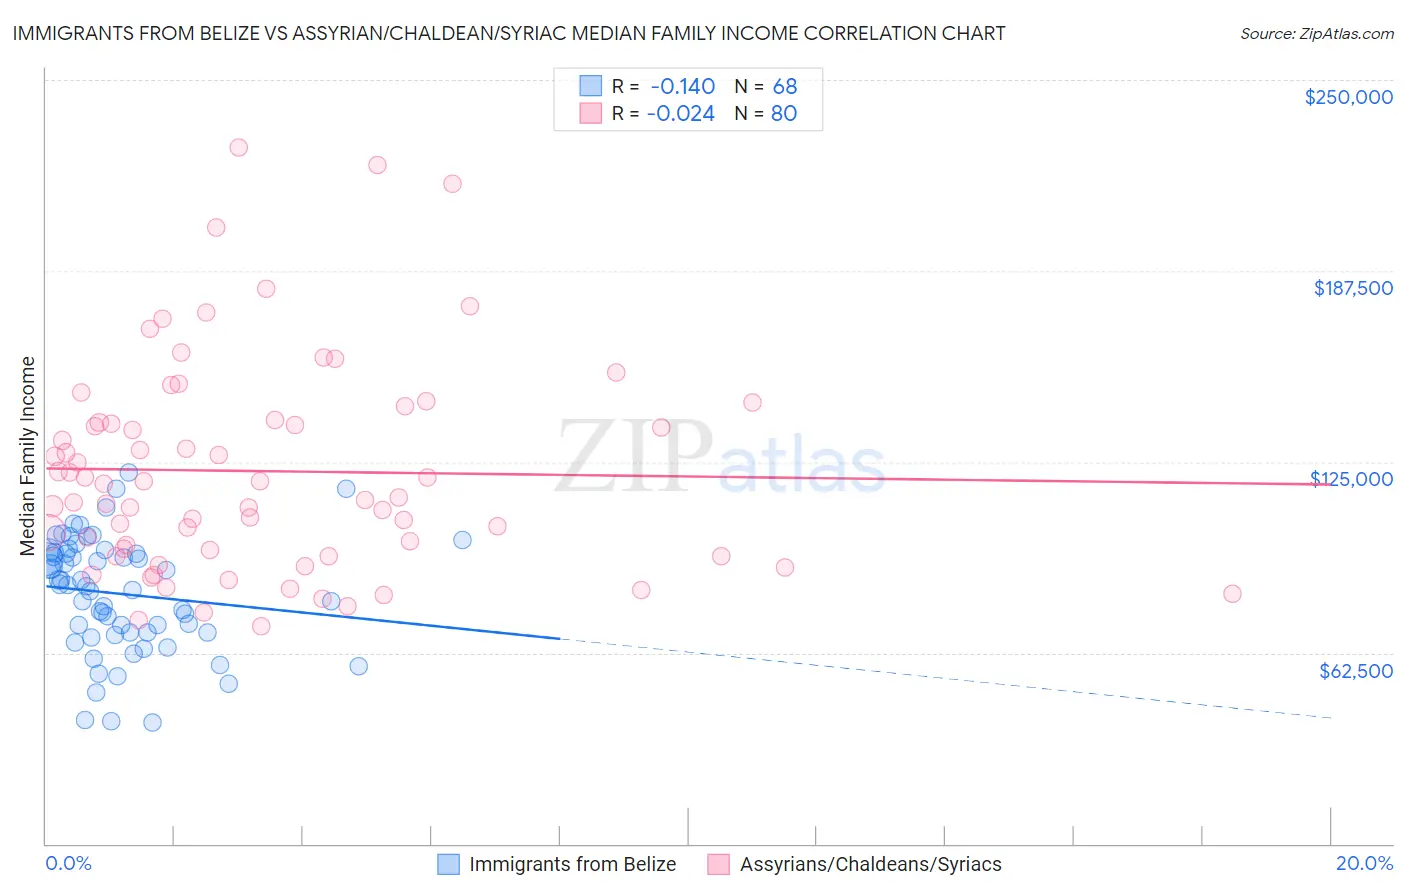
Immigrants from Belize vs Assyrian/Chaldean/Syriac Median Family Income Correlation Chart

The statistical analysis conducted on geographies consisting of 130,266,359 people shows a poor negative correlation between the proportion of Immigrants from Belize and median family income in the United States with a correlation coefficient (R) of -0.140 and weighted average of $89,197. Similarly, the statistical analysis conducted on geographies consisting of 110,249,217 people shows no correlation between the proportion of Assyrians/Chaldeans/Syriacs and median family income in the United States with a correlation coefficient (R) of -0.024 and weighted average of $109,622, a difference of 22.9%.
Immigrants from Belize vs Assyrian/Chaldean/Syriac Median Family Income

Median Family Income Correlation Summary

MeasurementImmigrants from BelizeAssyrian/Chaldean/Syriac
Minimum$39,621$71,012
Maximum$121,707$228,043
Range$82,086$157,031
Mean$81,787$121,955
Median$84,449$115,499
Interquartile 25% (IQ1)$69,088$95,222
Interquartile 75% (IQ3)$95,112$138,288
Interquartile Range (IQR)$26,023$43,065
Standard Deviation (Sample)$18,723$34,820
Standard Deviation (Population)$18,585$34,602

Similar Demographics by Median Family Income

Demographics Similar to Immigrants from Belize by Median Family Income

In terms of median family income, the demographic groups most similar to Immigrants from Belize are Immigrants from Grenada ($89,249, a difference of 0.060%), Immigrants from Jamaica ($89,268, a difference of 0.080%), Immigrants from Zaire ($89,285, a difference of 0.10%), British West Indian ($88,987, a difference of 0.24%), and Blackfeet ($88,717, a difference of 0.54%).
DemographicsRating | RankMedian Family Income
Immigrants | Liberia
0.2
/100
|
#272
Tragic
$90,450
Immigrants | Micronesia
0.2
/100
|
#273
Tragic
$90,345
Spanish Americans
0.2
/100
|
#274
Tragic
$90,322
Immigrants | St. Vincent and the Grenadines
0.2
/100
|
#275
Tragic
$90,094
Immigrants | Zaire
0.1
/100
|
#276
Tragic
$89,285
Immigrants | Jamaica
0.1
/100
|
#277
Tragic
$89,268
Immigrants | Grenada
0.1
/100
|
#278
Tragic
$89,249
Immigrants | Belize
0.1
/100
|
#279
Tragic
$89,197
British West Indians
0.1
/100
|
#280
Tragic
$88,987
Blackfeet
0.1
/100
|
#281
Tragic
$88,717
Comanche
0.1
/100
|
#282
Tragic
$88,556
Bangladeshis
0.1
/100
|
#283
Tragic
$88,358
Indonesians
0.1
/100
|
#284
Tragic
$88,301
Guatemalans
0.1
/100
|
#285
Tragic
$88,295
Immigrants | Nicaragua
0.1
/100
|
#286
Tragic
$88,267

Demographics Similar to Assyrians/Chaldeans/Syriacs by Median Family Income

In terms of median family income, the demographic groups most similar to Assyrians/Chaldeans/Syriacs are Immigrants from Ukraine ($109,645, a difference of 0.020%), Macedonian ($109,668, a difference of 0.040%), Armenian ($109,692, a difference of 0.060%), Immigrants from Kuwait ($109,731, a difference of 0.10%), and Immigrants from Brazil ($109,418, a difference of 0.19%).
DemographicsRating | RankMedian Family Income
Zimbabweans
97.7
/100
|
#95
Exceptional
$110,011
Immigrants | Moldova
97.7
/100
|
#96
Exceptional
$109,975
Jordanians
97.5
/100
|
#97
Exceptional
$109,865
Immigrants | Kuwait
97.4
/100
|
#98
Exceptional
$109,731
Armenians
97.3
/100
|
#99
Exceptional
$109,692
Macedonians
97.3
/100
|
#100
Exceptional
$109,668
Immigrants | Ukraine
97.2
/100
|
#101
Exceptional
$109,645
Assyrians/Chaldeans/Syriacs
97.2
/100
|
#102
Exceptional
$109,622
Immigrants | Brazil
96.9
/100
|
#103
Exceptional
$109,418
Palestinians
96.9
/100
|
#104
Exceptional
$109,413
Syrians
96.7
/100
|
#105
Exceptional
$109,299
Albanians
96.4
/100
|
#106
Exceptional
$109,136
Immigrants | North Macedonia
96.4
/100
|
#107
Exceptional
$109,136
Immigrants | Zimbabwe
95.9
/100
|
#108
Exceptional
$108,830
Immigrants | Afghanistan
95.6
/100
|
#109
Exceptional
$108,709