Immigrants from Belize vs Puerto Rican Median Family Income
COMPARE
Immigrants from Belize
Puerto Rican
Median Family Income
Median Family Income Comparison
Immigrants from Belize
Puerto Ricans
$89,197
MEDIAN FAMILY INCOME
0.1/ 100
METRIC RATING
279th/ 347
METRIC RANK
$70,423
MEDIAN FAMILY INCOME
0.0/ 100
METRIC RATING
346th/ 347
METRIC RANK
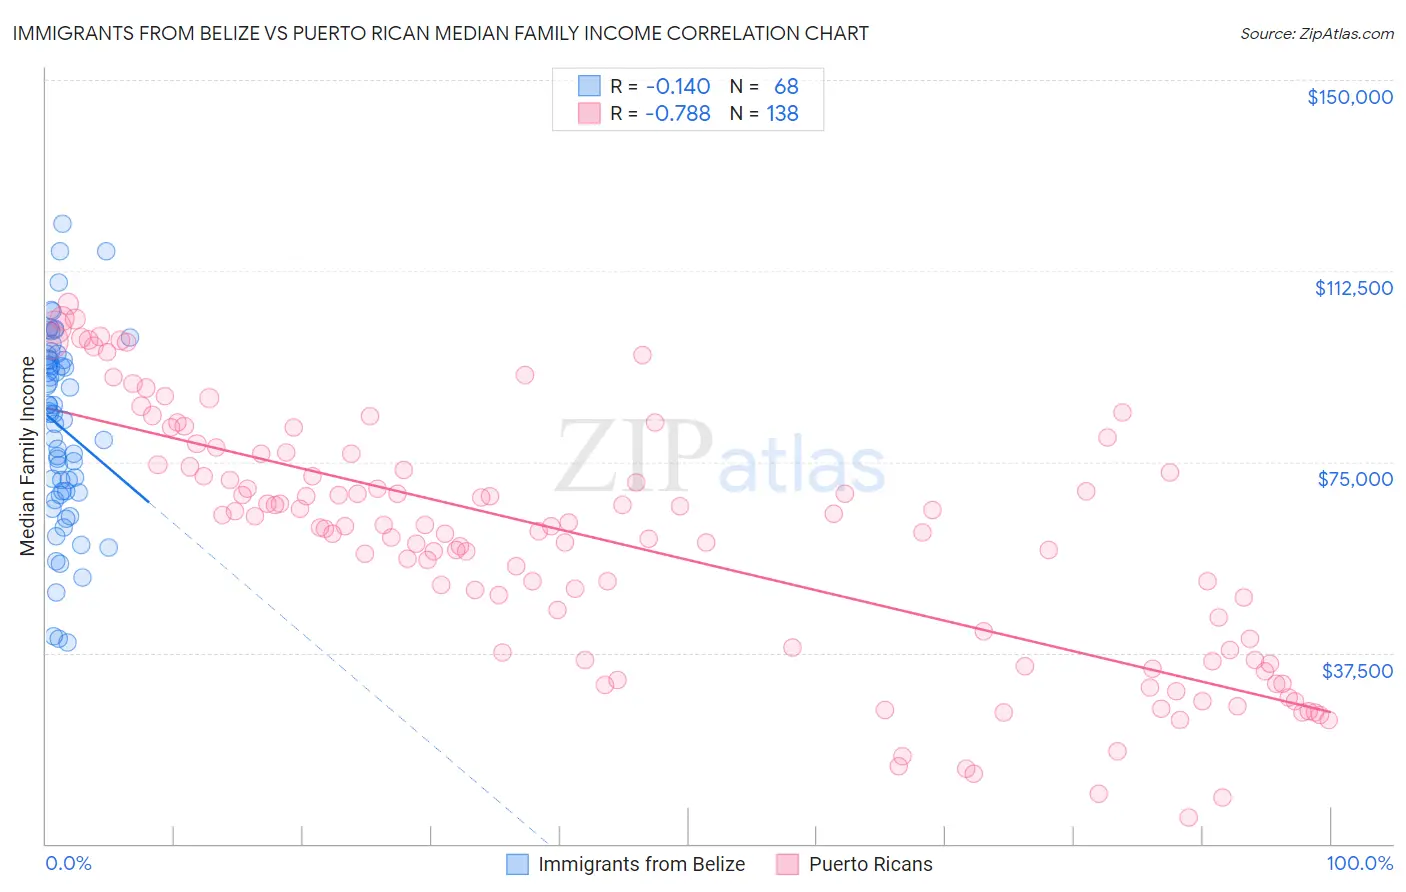
Immigrants from Belize vs Puerto Rican Median Family Income Correlation Chart
The statistical analysis conducted on geographies consisting of 130,266,359 people shows a poor negative correlation between the proportion of Immigrants from Belize and median family income in the United States with a correlation coefficient (R) of -0.140 and weighted average of $89,197. Similarly, the statistical analysis conducted on geographies consisting of 527,319,729 people shows a strong negative correlation between the proportion of Puerto Ricans and median family income in the United States with a correlation coefficient (R) of -0.788 and weighted average of $70,423, a difference of 26.7%.
Median Family Income Correlation Summary
| Measurement | Immigrants from Belize | Puerto Rican |
| Minimum | $39,621 | $5,070 |
| Maximum | $121,707 | $105,977 |
| Range | $82,086 | $100,907 |
| Mean | $81,787 | $59,210 |
| Median | $84,449 | $62,177 |
| Interquartile 25% (IQ1) | $69,088 | $37,461 |
| Interquartile 75% (IQ3) | $95,112 | $74,478 |
| Interquartile Range (IQR) | $26,023 | $37,017 |
| Standard Deviation (Sample) | $18,723 | $24,299 |
| Standard Deviation (Population) | $18,585 | $24,211 |
Similar Demographics by Median Family Income
Demographics Similar to Immigrants from Belize by Median Family Income
In terms of median family income, the demographic groups most similar to Immigrants from Belize are Immigrants from Grenada ($89,249, a difference of 0.060%), Immigrants from Jamaica ($89,268, a difference of 0.080%), Immigrants from Zaire ($89,285, a difference of 0.10%), British West Indian ($88,987, a difference of 0.24%), and Blackfeet ($88,717, a difference of 0.54%).
| Demographics | Rating | Rank | Median Family Income |
| Immigrants | Liberia | 0.2 /100 | #272 | Tragic $90,450 |
| Immigrants | Micronesia | 0.2 /100 | #273 | Tragic $90,345 |
| Spanish Americans | 0.2 /100 | #274 | Tragic $90,322 |
| Immigrants | St. Vincent and the Grenadines | 0.2 /100 | #275 | Tragic $90,094 |
| Immigrants | Zaire | 0.1 /100 | #276 | Tragic $89,285 |
| Immigrants | Jamaica | 0.1 /100 | #277 | Tragic $89,268 |
| Immigrants | Grenada | 0.1 /100 | #278 | Tragic $89,249 |
| Immigrants | Belize | 0.1 /100 | #279 | Tragic $89,197 |
| British West Indians | 0.1 /100 | #280 | Tragic $88,987 |
| Blackfeet | 0.1 /100 | #281 | Tragic $88,717 |
| Comanche | 0.1 /100 | #282 | Tragic $88,556 |
| Bangladeshis | 0.1 /100 | #283 | Tragic $88,358 |
| Indonesians | 0.1 /100 | #284 | Tragic $88,301 |
| Guatemalans | 0.1 /100 | #285 | Tragic $88,295 |
| Immigrants | Nicaragua | 0.1 /100 | #286 | Tragic $88,267 |
Demographics Similar to Puerto Ricans by Median Family Income
In terms of median family income, the demographic groups most similar to Puerto Ricans are Navajo ($70,989, a difference of 0.80%), Tohono O'odham ($72,193, a difference of 2.5%), Lumbee ($68,679, a difference of 2.5%), Houma ($76,188, a difference of 8.2%), and Crow ($76,605, a difference of 8.8%).
| Demographics | Rating | Rank | Median Family Income |
| Kiowa | 0.0 /100 | #333 | Tragic $80,885 |
| Menominee | 0.0 /100 | #334 | Tragic $79,563 |
| Yup'ik | 0.0 /100 | #335 | Tragic $79,290 |
| Immigrants | Cuba | 0.0 /100 | #336 | Tragic $78,249 |
| Yuman | 0.0 /100 | #337 | Tragic $78,055 |
| Immigrants | Yemen | 0.0 /100 | #338 | Tragic $77,457 |
| Pima | 0.0 /100 | #339 | Tragic $77,431 |
| Hopi | 0.0 /100 | #340 | Tragic $77,188 |
| Pueblo | 0.0 /100 | #341 | Tragic $76,880 |
| Crow | 0.0 /100 | #342 | Tragic $76,605 |
| Houma | 0.0 /100 | #343 | Tragic $76,188 |
| Tohono O'odham | 0.0 /100 | #344 | Tragic $72,193 |
| Navajo | 0.0 /100 | #345 | Tragic $70,989 |
| Puerto Ricans | 0.0 /100 | #346 | Tragic $70,423 |
| Lumbee | 0.0 /100 | #347 | Tragic $68,679 |