Immigrants from Belarus vs Croatian Median Earnings
COMPARE
Immigrants from Belarus
Croatian
Median Earnings
Median Earnings Comparison
Immigrants from Belarus
Croatians
$53,043
MEDIAN EARNINGS
100.0/ 100
METRIC RATING
37th/ 347
METRIC RANK
$49,724
MEDIAN EARNINGS
99.0/ 100
METRIC RATING
94th/ 347
METRIC RANK
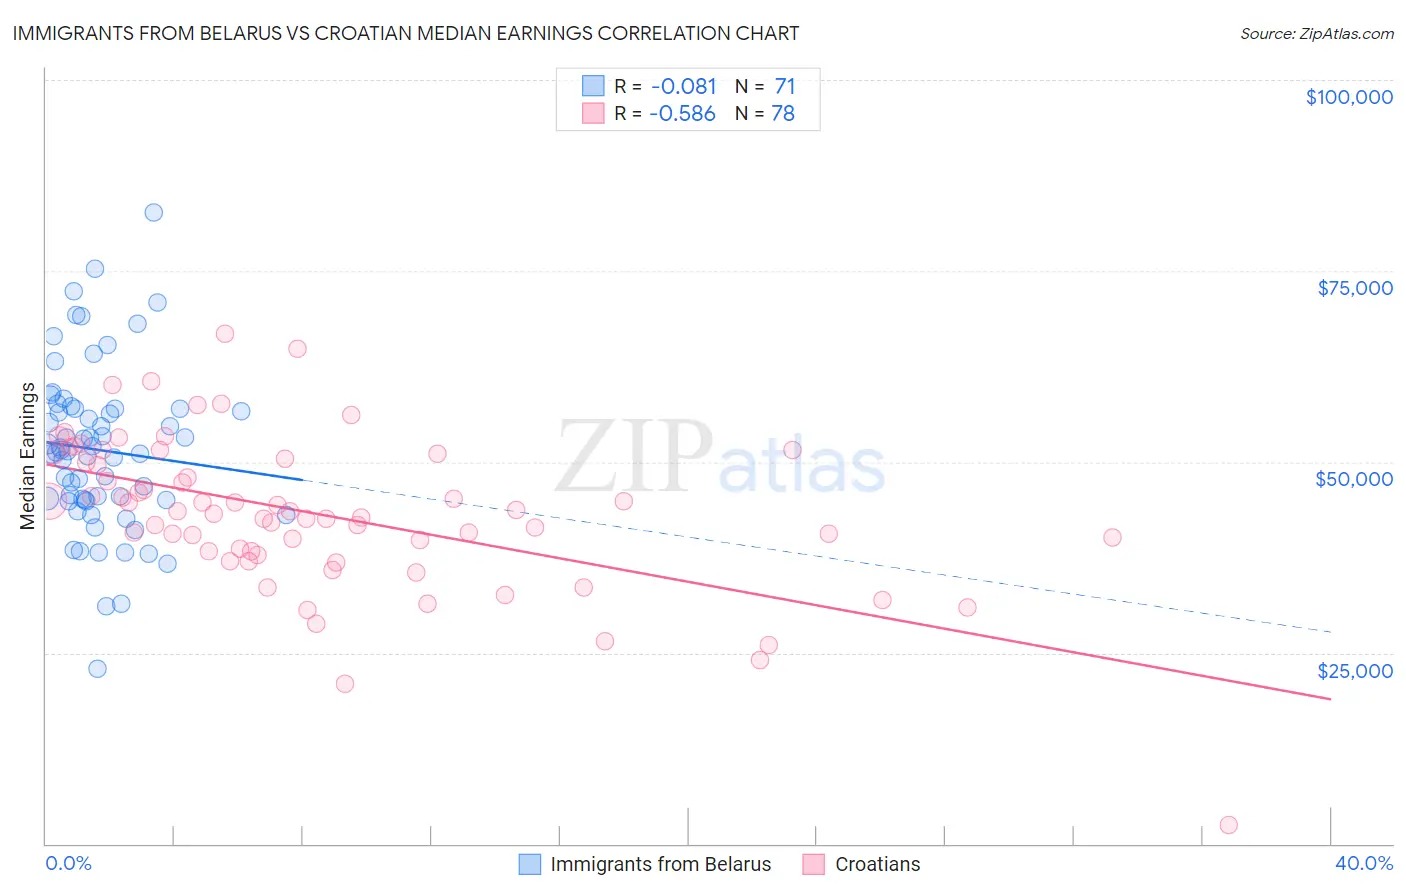
Immigrants from Belarus vs Croatian Median Earnings Correlation Chart
The statistical analysis conducted on geographies consisting of 150,193,045 people shows a slight negative correlation between the proportion of Immigrants from Belarus and median earnings in the United States with a correlation coefficient (R) of -0.081 and weighted average of $53,043. Similarly, the statistical analysis conducted on geographies consisting of 375,721,737 people shows a substantial negative correlation between the proportion of Croatians and median earnings in the United States with a correlation coefficient (R) of -0.586 and weighted average of $49,724, a difference of 6.7%.
Median Earnings Correlation Summary
| Measurement | Immigrants from Belarus | Croatian |
| Minimum | $22,866 | $2,499 |
| Maximum | $82,699 | $66,786 |
| Range | $59,833 | $64,287 |
| Mean | $51,554 | $43,106 |
| Median | $51,310 | $43,408 |
| Interquartile 25% (IQ1) | $45,000 | $38,221 |
| Interquartile 75% (IQ3) | $56,946 | $50,378 |
| Interquartile Range (IQR) | $11,946 | $12,158 |
| Standard Deviation (Sample) | $10,748 | $10,203 |
| Standard Deviation (Population) | $10,672 | $10,137 |
Similar Demographics by Median Earnings
Demographics Similar to Immigrants from Belarus by Median Earnings
In terms of median earnings, the demographic groups most similar to Immigrants from Belarus are Latvian ($53,001, a difference of 0.080%), Immigrants from Turkey ($52,960, a difference of 0.16%), Israeli ($52,937, a difference of 0.20%), Immigrants from Denmark ($53,186, a difference of 0.27%), and Immigrants from Switzerland ($53,211, a difference of 0.32%).
| Demographics | Rating | Rank | Median Earnings |
| Cambodians | 100.0 /100 | #30 | Exceptional $53,386 |
| Russians | 100.0 /100 | #31 | Exceptional $53,334 |
| Immigrants | Asia | 100.0 /100 | #32 | Exceptional $53,310 |
| Immigrants | Greece | 100.0 /100 | #33 | Exceptional $53,282 |
| Immigrants | Sri Lanka | 100.0 /100 | #34 | Exceptional $53,268 |
| Immigrants | Switzerland | 100.0 /100 | #35 | Exceptional $53,211 |
| Immigrants | Denmark | 100.0 /100 | #36 | Exceptional $53,186 |
| Immigrants | Belarus | 100.0 /100 | #37 | Exceptional $53,043 |
| Latvians | 100.0 /100 | #38 | Exceptional $53,001 |
| Immigrants | Turkey | 100.0 /100 | #39 | Exceptional $52,960 |
| Israelis | 100.0 /100 | #40 | Exceptional $52,937 |
| Immigrants | Lithuania | 100.0 /100 | #41 | Exceptional $52,769 |
| Maltese | 100.0 /100 | #42 | Exceptional $52,526 |
| Immigrants | Malaysia | 100.0 /100 | #43 | Exceptional $52,514 |
| Bulgarians | 100.0 /100 | #44 | Exceptional $52,512 |
Demographics Similar to Croatians by Median Earnings
In terms of median earnings, the demographic groups most similar to Croatians are Immigrants from England ($49,722, a difference of 0.0%), Immigrants from Lebanon ($49,682, a difference of 0.090%), Immigrants from North Macedonia ($49,658, a difference of 0.13%), Immigrants from Northern Africa ($49,648, a difference of 0.15%), and Armenian ($49,804, a difference of 0.16%).
| Demographics | Rating | Rank | Median Earnings |
| Immigrants | Uzbekistan | 99.5 /100 | #87 | Exceptional $50,151 |
| Albanians | 99.4 /100 | #88 | Exceptional $50,116 |
| Immigrants | North America | 99.4 /100 | #89 | Exceptional $50,108 |
| Italians | 99.3 /100 | #90 | Exceptional $49,915 |
| Macedonians | 99.2 /100 | #91 | Exceptional $49,893 |
| Immigrants | Argentina | 99.2 /100 | #92 | Exceptional $49,841 |
| Armenians | 99.1 /100 | #93 | Exceptional $49,804 |
| Croatians | 99.0 /100 | #94 | Exceptional $49,724 |
| Immigrants | England | 99.0 /100 | #95 | Exceptional $49,722 |
| Immigrants | Lebanon | 99.0 /100 | #96 | Exceptional $49,682 |
| Immigrants | North Macedonia | 98.9 /100 | #97 | Exceptional $49,658 |
| Immigrants | Northern Africa | 98.9 /100 | #98 | Exceptional $49,648 |
| Immigrants | Afghanistan | 98.9 /100 | #99 | Exceptional $49,645 |
| Immigrants | Poland | 98.9 /100 | #100 | Exceptional $49,633 |
| Jordanians | 98.9 /100 | #101 | Exceptional $49,632 |