Immigrants from Belarus vs Inupiat Unemployment Among Ages 16 to 19 years
COMPARE
Immigrants from Belarus
Inupiat
Unemployment Among Ages 16 to 19 years
Unemployment Among Ages 16 to 19 years Comparison
Immigrants from Belarus
Inupiat
18.6%
UNEMPLOYMENT AMONG AGES 16 TO 19 YEARS
0.8/ 100
METRIC RATING
245th/ 347
METRIC RANK
28.1%
UNEMPLOYMENT AMONG AGES 16 TO 19 YEARS
0.0/ 100
METRIC RATING
342nd/ 347
METRIC RANK
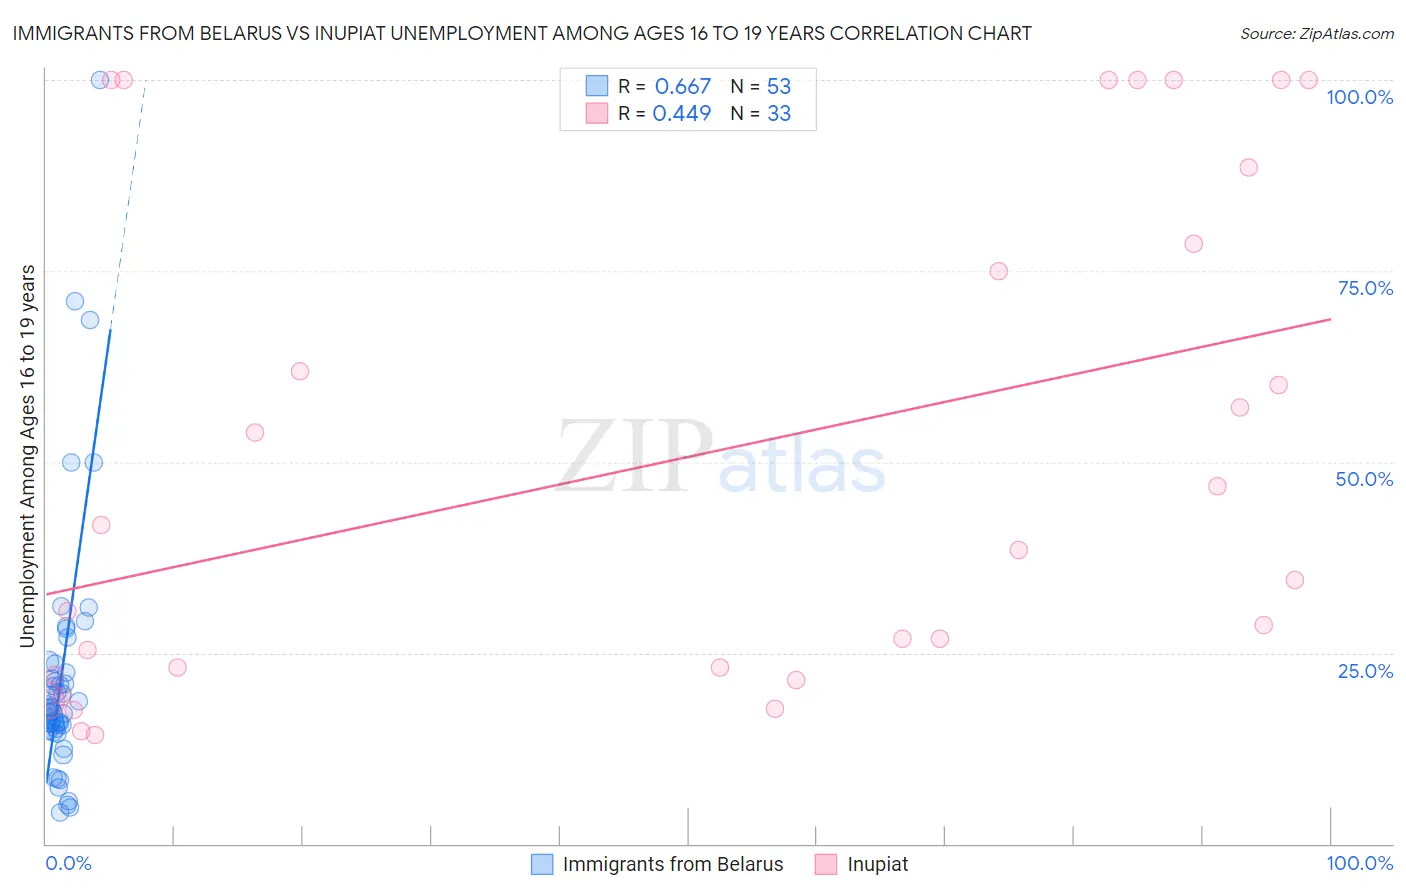
Immigrants from Belarus vs Inupiat Unemployment Among Ages 16 to 19 years Correlation Chart
The statistical analysis conducted on geographies consisting of 145,960,072 people shows a significant positive correlation between the proportion of Immigrants from Belarus and unemployment rate among population between the ages 16 and 19 in the United States with a correlation coefficient (R) of 0.667 and weighted average of 18.6%. Similarly, the statistical analysis conducted on geographies consisting of 94,709,407 people shows a moderate positive correlation between the proportion of Inupiat and unemployment rate among population between the ages 16 and 19 in the United States with a correlation coefficient (R) of 0.449 and weighted average of 28.1%, a difference of 50.9%.
Unemployment Among Ages 16 to 19 years Correlation Summary
| Measurement | Immigrants from Belarus | Inupiat |
| Minimum | 4.1% | 14.3% |
| Maximum | 100.0% | 100.0% |
| Range | 95.9% | 85.7% |
| Mean | 22.0% | 50.5% |
| Median | 17.4% | 38.5% |
| Interquartile 25% (IQ1) | 14.9% | 22.5% |
| Interquartile 75% (IQ3) | 23.1% | 83.6% |
| Interquartile Range (IQR) | 8.1% | 61.1% |
| Standard Deviation (Sample) | 17.2% | 32.3% |
| Standard Deviation (Population) | 17.0% | 31.8% |
Similar Demographics by Unemployment Among Ages 16 to 19 years
Demographics Similar to Immigrants from Belarus by Unemployment Among Ages 16 to 19 years
In terms of unemployment among ages 16 to 19 years, the demographic groups most similar to Immigrants from Belarus are Guatemalan (18.6%, a difference of 0.010%), Mexican (18.5%, a difference of 0.22%), Moroccan (18.5%, a difference of 0.38%), Immigrants from South America (18.7%, a difference of 0.42%), and Immigrants from Israel (18.7%, a difference of 0.47%).
| Demographics | Rating | Rank | Unemployment Among Ages 16 to 19 years |
| South Americans | 2.6 /100 | #238 | Tragic 18.3% |
| Native Hawaiians | 2.4 /100 | #239 | Tragic 18.3% |
| Immigrants | Cabo Verde | 2.0 /100 | #240 | Tragic 18.4% |
| Immigrants | Ukraine | 1.3 /100 | #241 | Tragic 18.5% |
| Moroccans | 1.1 /100 | #242 | Tragic 18.5% |
| Mexicans | 0.9 /100 | #243 | Tragic 18.5% |
| Guatemalans | 0.8 /100 | #244 | Tragic 18.6% |
| Immigrants | Belarus | 0.8 /100 | #245 | Tragic 18.6% |
| Immigrants | South America | 0.5 /100 | #246 | Tragic 18.7% |
| Immigrants | Israel | 0.5 /100 | #247 | Tragic 18.7% |
| Delaware | 0.5 /100 | #248 | Tragic 18.7% |
| Puget Sound Salish | 0.5 /100 | #249 | Tragic 18.7% |
| Panamanians | 0.4 /100 | #250 | Tragic 18.7% |
| Sub-Saharan Africans | 0.4 /100 | #251 | Tragic 18.7% |
| Immigrants | Guatemala | 0.4 /100 | #252 | Tragic 18.7% |
Demographics Similar to Inupiat by Unemployment Among Ages 16 to 19 years
In terms of unemployment among ages 16 to 19 years, the demographic groups most similar to Inupiat are Puerto Rican (27.5%, a difference of 2.0%), Navajo (29.0%, a difference of 3.5%), Colville (29.7%, a difference of 5.8%), Crow (26.2%, a difference of 6.9%), and Immigrants from Grenada (25.7%, a difference of 9.0%).
| Demographics | Rating | Rank | Unemployment Among Ages 16 to 19 years |
| Paiute | 0.0 /100 | #333 | Tragic 24.4% |
| Guyanese | 0.0 /100 | #334 | Tragic 24.8% |
| Arapaho | 0.0 /100 | #335 | Tragic 25.2% |
| Kiowa | 0.0 /100 | #336 | Tragic 25.2% |
| Immigrants | Guyana | 0.0 /100 | #337 | Tragic 25.5% |
| Immigrants | St. Vincent and the Grenadines | 0.0 /100 | #338 | Tragic 25.7% |
| Immigrants | Grenada | 0.0 /100 | #339 | Tragic 25.7% |
| Crow | 0.0 /100 | #340 | Tragic 26.2% |
| Puerto Ricans | 0.0 /100 | #341 | Tragic 27.5% |
| Inupiat | 0.0 /100 | #342 | Tragic 28.1% |
| Navajo | 0.0 /100 | #343 | Tragic 29.0% |
| Colville | 0.0 /100 | #344 | Tragic 29.7% |
| Hopi | 0.0 /100 | #345 | Tragic 30.7% |
| Yuman | 0.0 /100 | #346 | Tragic 37.4% |
| Yup'ik | 0.0 /100 | #347 | Tragic 41.0% |