Immigrants from Belarus vs Immigrants from Romania Median Male Earnings
COMPARE
Immigrants from Belarus
Immigrants from Romania
Median Male Earnings
Median Male Earnings Comparison
Immigrants from Belarus
Immigrants from Romania
$62,658
MEDIAN MALE EARNINGS
100.0/ 100
METRIC RATING
43rd/ 347
METRIC RANK
$61,040
MEDIAN MALE EARNINGS
99.8/ 100
METRIC RATING
62nd/ 347
METRIC RANK
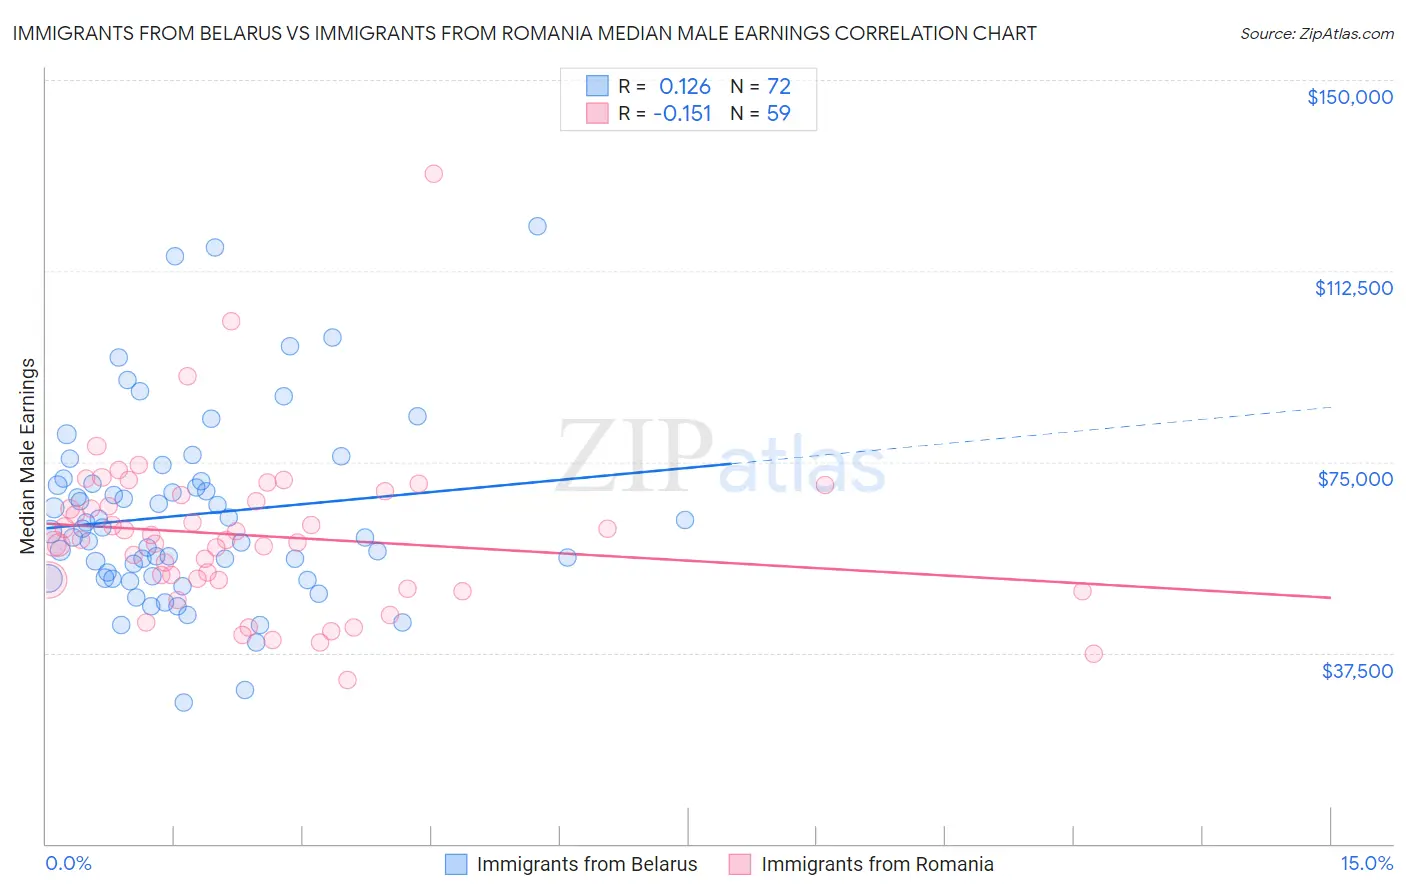
Immigrants from Belarus vs Immigrants from Romania Median Male Earnings Correlation Chart
The statistical analysis conducted on geographies consisting of 150,194,615 people shows a poor positive correlation between the proportion of Immigrants from Belarus and median male earnings in the United States with a correlation coefficient (R) of 0.126 and weighted average of $62,658. Similarly, the statistical analysis conducted on geographies consisting of 256,975,343 people shows a poor negative correlation between the proportion of Immigrants from Romania and median male earnings in the United States with a correlation coefficient (R) of -0.151 and weighted average of $61,040, a difference of 2.6%.
Median Male Earnings Correlation Summary
| Measurement | Immigrants from Belarus | Immigrants from Romania |
| Minimum | $27,820 | $32,206 |
| Maximum | $121,250 | $131,536 |
| Range | $93,430 | $99,330 |
| Mean | $64,628 | $60,508 |
| Median | $61,571 | $59,717 |
| Interquartile 25% (IQ1) | $52,308 | $51,701 |
| Interquartile 75% (IQ3) | $70,925 | $68,594 |
| Interquartile Range (IQR) | $18,618 | $16,893 |
| Standard Deviation (Sample) | $18,362 | $15,927 |
| Standard Deviation (Population) | $18,234 | $15,791 |
Demographics Similar to Immigrants from Belarus and Immigrants from Romania by Median Male Earnings
In terms of median male earnings, the demographic groups most similar to Immigrants from Belarus are Immigrants from Greece ($62,689, a difference of 0.050%), Cambodian ($62,516, a difference of 0.23%), Bulgarian ($62,378, a difference of 0.45%), Immigrants from Czechoslovakia ($62,217, a difference of 0.71%), and Immigrants from Austria ($62,164, a difference of 0.79%). Similarly, the demographic groups most similar to Immigrants from Romania are Bolivian ($61,066, a difference of 0.040%), Immigrants from Netherlands ($61,096, a difference of 0.090%), Egyptian ($61,095, a difference of 0.090%), New Zealander ($61,199, a difference of 0.26%), and Immigrants from Scotland ($61,220, a difference of 0.30%).
| Demographics | Rating | Rank | Median Male Earnings |
| Immigrants | Greece | 100.0 /100 | #42 | Exceptional $62,689 |
| Immigrants | Belarus | 100.0 /100 | #43 | Exceptional $62,658 |
| Cambodians | 100.0 /100 | #44 | Exceptional $62,516 |
| Bulgarians | 100.0 /100 | #45 | Exceptional $62,378 |
| Immigrants | Czechoslovakia | 99.9 /100 | #46 | Exceptional $62,217 |
| Immigrants | Austria | 99.9 /100 | #47 | Exceptional $62,164 |
| Immigrants | Malaysia | 99.9 /100 | #48 | Exceptional $62,121 |
| Immigrants | Europe | 99.9 /100 | #49 | Exceptional $62,057 |
| Bhutanese | 99.9 /100 | #50 | Exceptional $61,759 |
| Estonians | 99.9 /100 | #51 | Exceptional $61,710 |
| Immigrants | Norway | 99.9 /100 | #52 | Exceptional $61,628 |
| South Africans | 99.9 /100 | #53 | Exceptional $61,460 |
| Immigrants | Latvia | 99.9 /100 | #54 | Exceptional $61,422 |
| Greeks | 99.9 /100 | #55 | Exceptional $61,242 |
| Lithuanians | 99.9 /100 | #56 | Exceptional $61,228 |
| Immigrants | Scotland | 99.9 /100 | #57 | Exceptional $61,220 |
| New Zealanders | 99.9 /100 | #58 | Exceptional $61,199 |
| Immigrants | Netherlands | 99.8 /100 | #59 | Exceptional $61,096 |
| Egyptians | 99.8 /100 | #60 | Exceptional $61,095 |
| Bolivians | 99.8 /100 | #61 | Exceptional $61,066 |
| Immigrants | Romania | 99.8 /100 | #62 | Exceptional $61,040 |