Immigrants from Belarus vs Immigrants from Ghana Median Male Earnings
COMPARE
Immigrants from Belarus
Immigrants from Ghana
Median Male Earnings
Median Male Earnings Comparison
Immigrants from Belarus
Immigrants from Ghana
$62,658
MEDIAN MALE EARNINGS
100.0/ 100
METRIC RATING
43rd/ 347
METRIC RANK
$51,836
MEDIAN MALE EARNINGS
6.9/ 100
METRIC RATING
219th/ 347
METRIC RANK
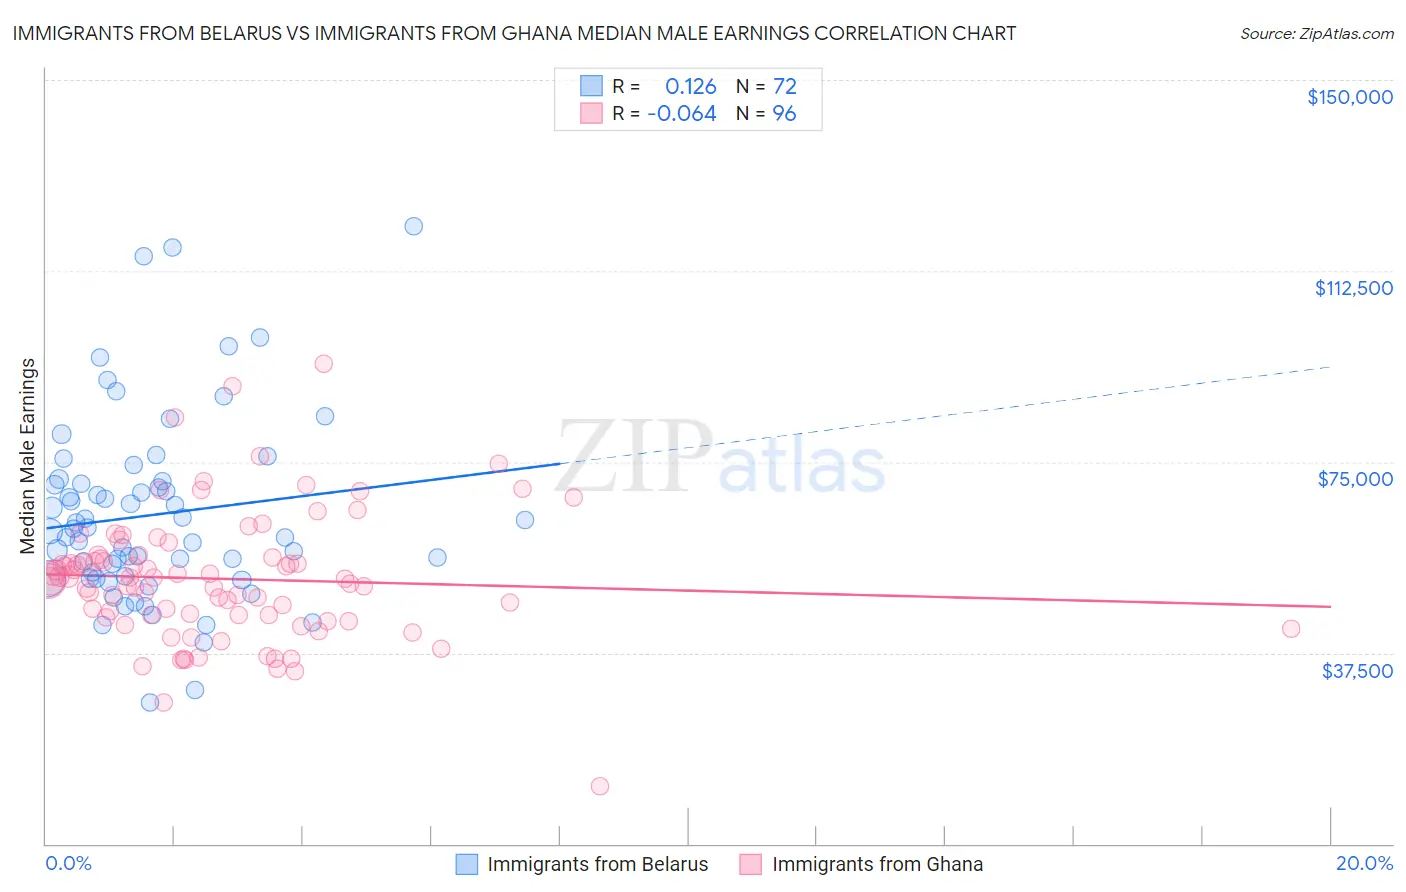
Immigrants from Belarus vs Immigrants from Ghana Median Male Earnings Correlation Chart
The statistical analysis conducted on geographies consisting of 150,194,615 people shows a poor positive correlation between the proportion of Immigrants from Belarus and median male earnings in the United States with a correlation coefficient (R) of 0.126 and weighted average of $62,658. Similarly, the statistical analysis conducted on geographies consisting of 199,928,244 people shows a slight negative correlation between the proportion of Immigrants from Ghana and median male earnings in the United States with a correlation coefficient (R) of -0.064 and weighted average of $51,836, a difference of 20.9%.
Median Male Earnings Correlation Summary
| Measurement | Immigrants from Belarus | Immigrants from Ghana |
| Minimum | $27,820 | $11,405 |
| Maximum | $121,250 | $94,205 |
| Range | $93,430 | $82,800 |
| Mean | $64,628 | $52,017 |
| Median | $61,571 | $51,835 |
| Interquartile 25% (IQ1) | $52,308 | $44,651 |
| Interquartile 75% (IQ3) | $70,925 | $56,389 |
| Interquartile Range (IQR) | $18,618 | $11,739 |
| Standard Deviation (Sample) | $18,362 | $12,685 |
| Standard Deviation (Population) | $18,234 | $12,619 |
Similar Demographics by Median Male Earnings
Demographics Similar to Immigrants from Belarus by Median Male Earnings
In terms of median male earnings, the demographic groups most similar to Immigrants from Belarus are Immigrants from Greece ($62,689, a difference of 0.050%), Immigrants from Turkey ($62,728, a difference of 0.11%), Cambodian ($62,516, a difference of 0.23%), Australian ($62,857, a difference of 0.32%), and Immigrants from South Africa ($62,899, a difference of 0.38%).
| Demographics | Rating | Rank | Median Male Earnings |
| Israelis | 100.0 /100 | #36 | Exceptional $63,228 |
| Immigrants | Sri Lanka | 100.0 /100 | #37 | Exceptional $63,099 |
| Maltese | 100.0 /100 | #38 | Exceptional $62,953 |
| Immigrants | South Africa | 100.0 /100 | #39 | Exceptional $62,899 |
| Australians | 100.0 /100 | #40 | Exceptional $62,857 |
| Immigrants | Turkey | 100.0 /100 | #41 | Exceptional $62,728 |
| Immigrants | Greece | 100.0 /100 | #42 | Exceptional $62,689 |
| Immigrants | Belarus | 100.0 /100 | #43 | Exceptional $62,658 |
| Cambodians | 100.0 /100 | #44 | Exceptional $62,516 |
| Bulgarians | 100.0 /100 | #45 | Exceptional $62,378 |
| Immigrants | Czechoslovakia | 99.9 /100 | #46 | Exceptional $62,217 |
| Immigrants | Austria | 99.9 /100 | #47 | Exceptional $62,164 |
| Immigrants | Malaysia | 99.9 /100 | #48 | Exceptional $62,121 |
| Immigrants | Europe | 99.9 /100 | #49 | Exceptional $62,057 |
| Bhutanese | 99.9 /100 | #50 | Exceptional $61,759 |
Demographics Similar to Immigrants from Ghana by Median Male Earnings
In terms of median male earnings, the demographic groups most similar to Immigrants from Ghana are Immigrants from Armenia ($51,793, a difference of 0.080%), Immigrants from Panama ($51,962, a difference of 0.24%), Immigrants from Senegal ($51,647, a difference of 0.37%), Immigrants from Bangladesh ($51,642, a difference of 0.38%), and Nigerian ($52,039, a difference of 0.39%).
| Demographics | Rating | Rank | Median Male Earnings |
| Cajuns | 10.7 /100 | #212 | Poor $52,325 |
| Native Hawaiians | 10.5 /100 | #213 | Poor $52,306 |
| Immigrants | Nonimmigrants | 9.3 /100 | #214 | Tragic $52,170 |
| Immigrants | Cameroon | 8.9 /100 | #215 | Tragic $52,119 |
| Immigrants | Venezuela | 8.3 /100 | #216 | Tragic $52,041 |
| Nigerians | 8.3 /100 | #217 | Tragic $52,039 |
| Immigrants | Panama | 7.7 /100 | #218 | Tragic $51,962 |
| Immigrants | Ghana | 6.9 /100 | #219 | Tragic $51,836 |
| Immigrants | Armenia | 6.6 /100 | #220 | Tragic $51,793 |
| Immigrants | Senegal | 5.8 /100 | #221 | Tragic $51,647 |
| Immigrants | Bangladesh | 5.8 /100 | #222 | Tragic $51,642 |
| Ecuadorians | 5.5 /100 | #223 | Tragic $51,596 |
| Immigrants | Cambodia | 5.5 /100 | #224 | Tragic $51,594 |
| Immigrants | Sudan | 5.0 /100 | #225 | Tragic $51,489 |
| Japanese | 4.9 /100 | #226 | Tragic $51,473 |