Immigrants from Barbados vs Macedonian 4 or more Vehicles in Household
COMPARE
Immigrants from Barbados
Macedonian
4 or more Vehicles in Household
4 or more Vehicles in Household Comparison
Immigrants from Barbados
Macedonians
3.6%
4 OR MORE VEHICLES IN HOUSEHOLD
0.0/ 100
METRIC RATING
340th/ 347
METRIC RANK
5.5%
4 OR MORE VEHICLES IN HOUSEHOLD
0.6/ 100
METRIC RATING
273rd/ 347
METRIC RANK
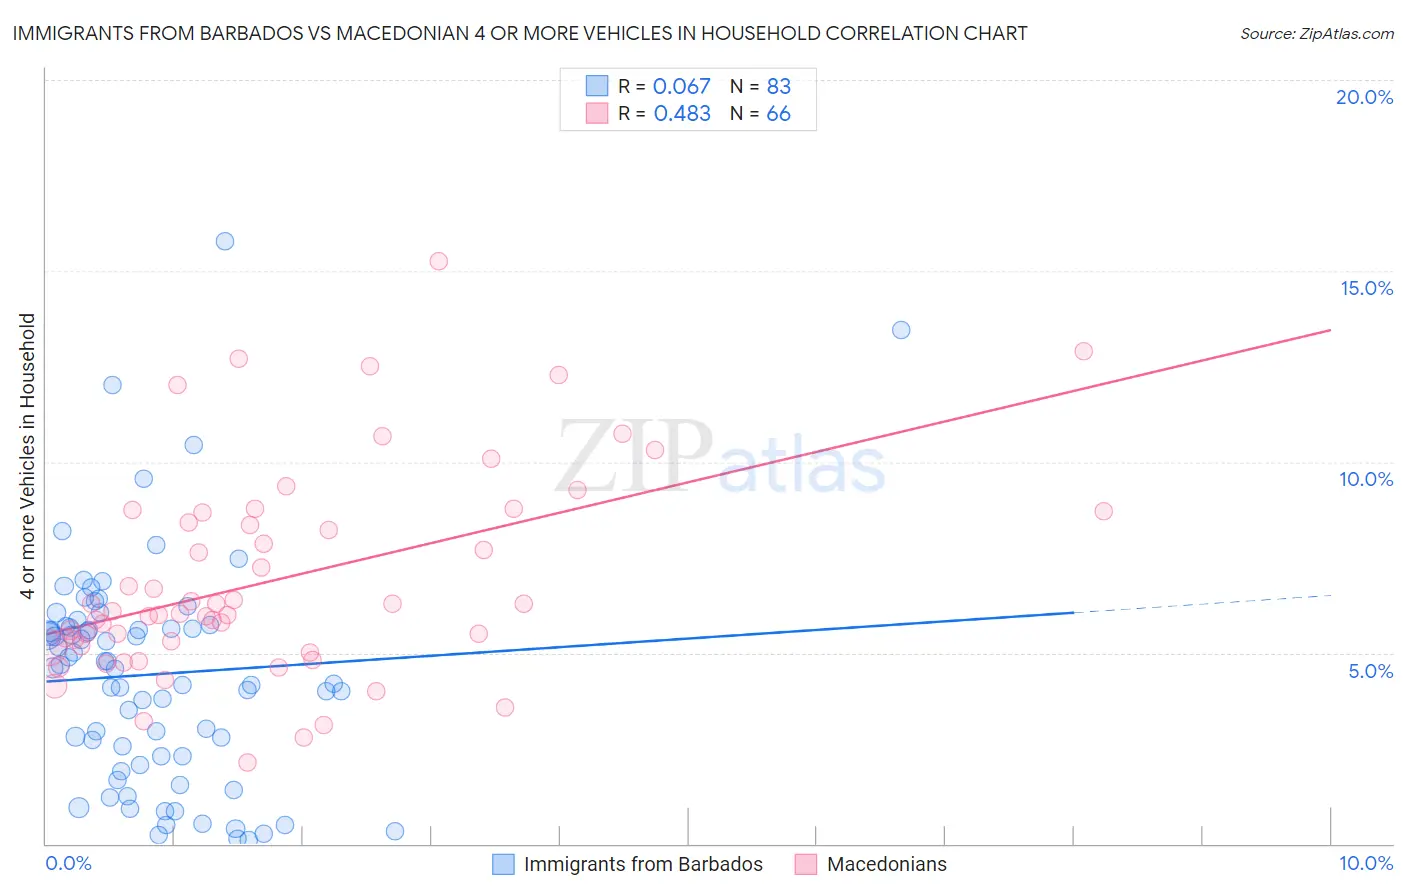
Immigrants from Barbados vs Macedonian 4 or more Vehicles in Household Correlation Chart
The statistical analysis conducted on geographies consisting of 112,222,140 people shows a slight positive correlation between the proportion of Immigrants from Barbados and percentage of households with 4 or more vehicles available in the United States with a correlation coefficient (R) of 0.067 and weighted average of 3.6%. Similarly, the statistical analysis conducted on geographies consisting of 131,939,711 people shows a moderate positive correlation between the proportion of Macedonians and percentage of households with 4 or more vehicles available in the United States with a correlation coefficient (R) of 0.483 and weighted average of 5.5%, a difference of 52.5%.
4 or more Vehicles in Household Correlation Summary
| Measurement | Immigrants from Barbados | Macedonian |
| Minimum | 0.11% | 2.1% |
| Maximum | 15.8% | 15.3% |
| Range | 15.7% | 13.1% |
| Mean | 4.4% | 6.9% |
| Median | 4.6% | 6.1% |
| Interquartile 25% (IQ1) | 2.3% | 5.2% |
| Interquartile 75% (IQ3) | 5.7% | 8.7% |
| Interquartile Range (IQR) | 3.4% | 3.5% |
| Standard Deviation (Sample) | 3.0% | 2.7% |
| Standard Deviation (Population) | 2.9% | 2.7% |
Similar Demographics by 4 or more Vehicles in Household
Demographics Similar to Immigrants from Barbados by 4 or more Vehicles in Household
In terms of 4 or more vehicles in household, the demographic groups most similar to Immigrants from Barbados are Immigrants from Uzbekistan (3.6%, a difference of 0.55%), Dominican (3.5%, a difference of 2.8%), Guyanese (3.5%, a difference of 3.5%), British West Indian (3.5%, a difference of 4.5%), and Immigrants from Cabo Verde (3.8%, a difference of 5.6%).
| Demographics | Rating | Rank | 4 or more Vehicles in Household |
| Immigrants | Albania | 0.0 /100 | #333 | Tragic 4.1% |
| Immigrants | Trinidad and Tobago | 0.0 /100 | #334 | Tragic 4.1% |
| Barbadians | 0.0 /100 | #335 | Tragic 3.9% |
| Immigrants | Bangladesh | 0.0 /100 | #336 | Tragic 3.9% |
| Vietnamese | 0.0 /100 | #337 | Tragic 3.9% |
| Immigrants | Cabo Verde | 0.0 /100 | #338 | Tragic 3.8% |
| Immigrants | Uzbekistan | 0.0 /100 | #339 | Tragic 3.6% |
| Immigrants | Barbados | 0.0 /100 | #340 | Tragic 3.6% |
| Dominicans | 0.0 /100 | #341 | Tragic 3.5% |
| Guyanese | 0.0 /100 | #342 | Tragic 3.5% |
| British West Indians | 0.0 /100 | #343 | Tragic 3.5% |
| Immigrants | Guyana | 0.0 /100 | #344 | Tragic 3.4% |
| Immigrants | Dominican Republic | 0.0 /100 | #345 | Tragic 3.3% |
| Immigrants | St. Vincent and the Grenadines | 0.0 /100 | #346 | Tragic 3.0% |
| Immigrants | Grenada | 0.0 /100 | #347 | Tragic 2.7% |
Demographics Similar to Macedonians by 4 or more Vehicles in Household
In terms of 4 or more vehicles in household, the demographic groups most similar to Macedonians are Immigrants from Kazakhstan (5.5%, a difference of 0.030%), Black/African American (5.5%, a difference of 0.12%), Immigrants from Sudan (5.5%, a difference of 0.23%), Cambodian (5.5%, a difference of 0.24%), and Immigrants from Latvia (5.5%, a difference of 0.25%).
| Demographics | Rating | Rank | 4 or more Vehicles in Household |
| Immigrants | Nepal | 0.9 /100 | #266 | Tragic 5.6% |
| Immigrants | Ukraine | 0.9 /100 | #267 | Tragic 5.6% |
| Colombians | 0.7 /100 | #268 | Tragic 5.5% |
| Carpatho Rusyns | 0.7 /100 | #269 | Tragic 5.5% |
| Okinawans | 0.6 /100 | #270 | Tragic 5.5% |
| Immigrants | Sudan | 0.6 /100 | #271 | Tragic 5.5% |
| Immigrants | Kazakhstan | 0.6 /100 | #272 | Tragic 5.5% |
| Macedonians | 0.6 /100 | #273 | Tragic 5.5% |
| Blacks/African Americans | 0.6 /100 | #274 | Tragic 5.5% |
| Cambodians | 0.5 /100 | #275 | Tragic 5.5% |
| Immigrants | Latvia | 0.5 /100 | #276 | Tragic 5.5% |
| Immigrants | Bulgaria | 0.5 /100 | #277 | Tragic 5.5% |
| Immigrants | Eastern Europe | 0.4 /100 | #278 | Tragic 5.4% |
| Immigrants | Uruguay | 0.3 /100 | #279 | Tragic 5.4% |
| Alsatians | 0.3 /100 | #280 | Tragic 5.4% |