Immigrants from Barbados vs Greek Median Female Earnings
COMPARE
Immigrants from Barbados
Greek
Median Female Earnings
Median Female Earnings Comparison
Immigrants from Barbados
Greeks
$41,685
MEDIAN FEMALE EARNINGS
98.4/ 100
METRIC RATING
99th/ 347
METRIC RANK
$42,336
MEDIAN FEMALE EARNINGS
99.6/ 100
METRIC RATING
79th/ 347
METRIC RANK
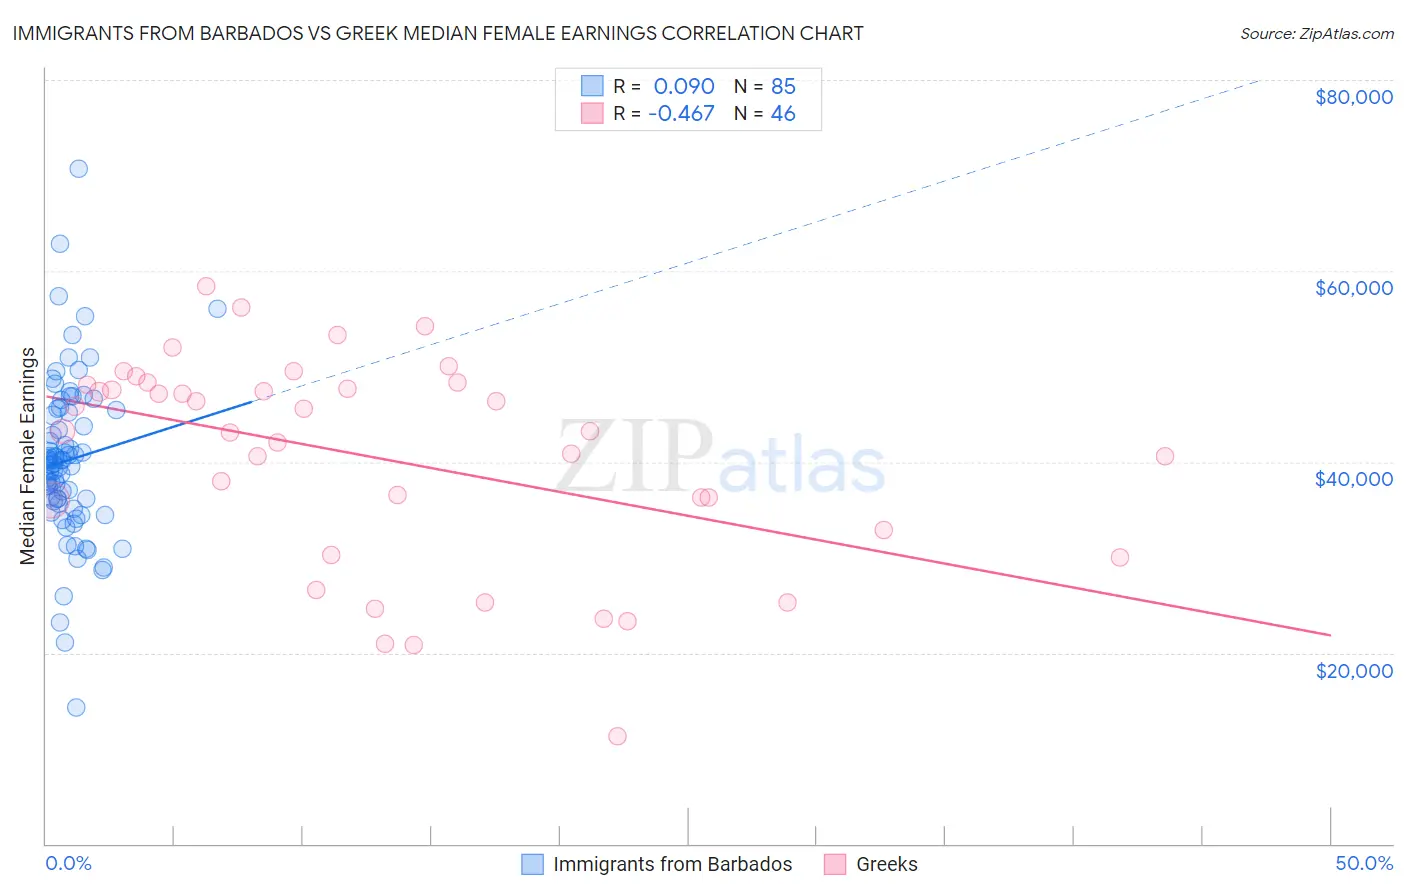
Immigrants from Barbados vs Greek Median Female Earnings Correlation Chart
The statistical analysis conducted on geographies consisting of 112,771,231 people shows a slight positive correlation between the proportion of Immigrants from Barbados and median female earnings in the United States with a correlation coefficient (R) of 0.090 and weighted average of $41,685. Similarly, the statistical analysis conducted on geographies consisting of 482,348,495 people shows a moderate negative correlation between the proportion of Greeks and median female earnings in the United States with a correlation coefficient (R) of -0.467 and weighted average of $42,336, a difference of 1.6%.
Median Female Earnings Correlation Summary
| Measurement | Immigrants from Barbados | Greek |
| Minimum | $14,324 | $11,250 |
| Maximum | $70,712 | $58,379 |
| Range | $56,388 | $47,129 |
| Mean | $40,171 | $40,351 |
| Median | $40,011 | $43,165 |
| Interquartile 25% (IQ1) | $35,731 | $32,889 |
| Interquartile 75% (IQ3) | $45,302 | $48,068 |
| Interquartile Range (IQR) | $9,570 | $15,179 |
| Standard Deviation (Sample) | $8,566 | $10,999 |
| Standard Deviation (Population) | $8,515 | $10,879 |
Demographics Similar to Immigrants from Barbados and Greeks by Median Female Earnings
In terms of median female earnings, the demographic groups most similar to Immigrants from Barbados are Immigrants from Scotland ($41,771, a difference of 0.21%), Immigrants from Hungary ($41,820, a difference of 0.32%), South African ($41,825, a difference of 0.34%), Immigrants from Netherlands ($41,870, a difference of 0.44%), and Moroccan ($41,872, a difference of 0.45%). Similarly, the demographic groups most similar to Greeks are Immigrants from Moldova ($42,304, a difference of 0.080%), Immigrants from Southern Europe ($42,275, a difference of 0.15%), Immigrants from Morocco ($42,229, a difference of 0.25%), Immigrants from Sierra Leone ($42,214, a difference of 0.29%), and Armenian ($42,212, a difference of 0.29%).
| Demographics | Rating | Rank | Median Female Earnings |
| Greeks | 99.6 /100 | #79 | Exceptional $42,336 |
| Immigrants | Moldova | 99.6 /100 | #80 | Exceptional $42,304 |
| Immigrants | Southern Europe | 99.5 /100 | #81 | Exceptional $42,275 |
| Immigrants | Morocco | 99.5 /100 | #82 | Exceptional $42,229 |
| Immigrants | Sierra Leone | 99.5 /100 | #83 | Exceptional $42,214 |
| Armenians | 99.5 /100 | #84 | Exceptional $42,212 |
| Laotians | 99.4 /100 | #85 | Exceptional $42,133 |
| Immigrants | St. Vincent and the Grenadines | 99.3 /100 | #86 | Exceptional $42,108 |
| Lithuanians | 99.3 /100 | #87 | Exceptional $42,108 |
| Immigrants | Northern Africa | 99.3 /100 | #88 | Exceptional $42,084 |
| Immigrants | Afghanistan | 99.3 /100 | #89 | Exceptional $42,055 |
| Ukrainians | 99.2 /100 | #90 | Exceptional $42,015 |
| Immigrants | Western Europe | 99.2 /100 | #91 | Exceptional $41,990 |
| Argentineans | 99.1 /100 | #92 | Exceptional $41,952 |
| Immigrants | Grenada | 99.0 /100 | #93 | Exceptional $41,932 |
| Moroccans | 98.9 /100 | #94 | Exceptional $41,872 |
| Immigrants | Netherlands | 98.9 /100 | #95 | Exceptional $41,870 |
| South Africans | 98.8 /100 | #96 | Exceptional $41,825 |
| Immigrants | Hungary | 98.8 /100 | #97 | Exceptional $41,820 |
| Immigrants | Scotland | 98.7 /100 | #98 | Exceptional $41,771 |
| Immigrants | Barbados | 98.4 /100 | #99 | Exceptional $41,685 |