Immigrants from Barbados vs Macedonian Single Male Poverty
COMPARE
Immigrants from Barbados
Macedonian
Single Male Poverty
Single Male Poverty Comparison
Immigrants from Barbados
Macedonians
12.7%
SINGLE MALE POVERTY
57.7/ 100
METRIC RATING
168th/ 347
METRIC RANK
12.9%
SINGLE MALE POVERTY
31.5/ 100
METRIC RATING
188th/ 347
METRIC RANK
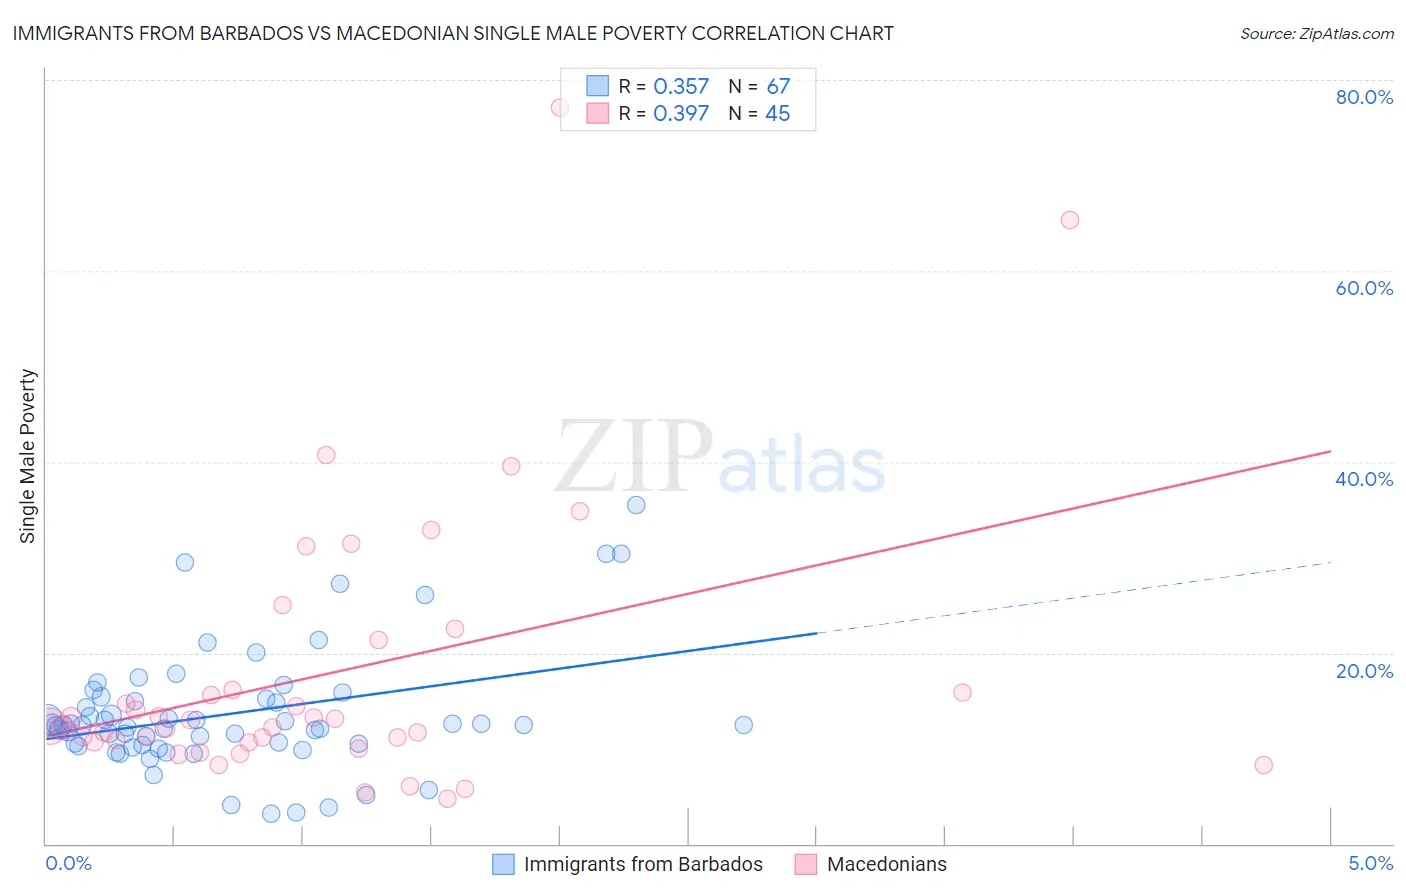
Immigrants from Barbados vs Macedonian Single Male Poverty Correlation Chart
The statistical analysis conducted on geographies consisting of 108,546,414 people shows a mild positive correlation between the proportion of Immigrants from Barbados and poverty level among single males in the United States with a correlation coefficient (R) of 0.357 and weighted average of 12.7%. Similarly, the statistical analysis conducted on geographies consisting of 122,668,243 people shows a mild positive correlation between the proportion of Macedonians and poverty level among single males in the United States with a correlation coefficient (R) of 0.397 and weighted average of 12.9%, a difference of 1.4%.
Single Male Poverty Correlation Summary
| Measurement | Immigrants from Barbados | Macedonian |
| Minimum | 3.1% | 4.8% |
| Maximum | 35.5% | 77.1% |
| Range | 32.4% | 72.3% |
| Mean | 13.6% | 17.9% |
| Median | 12.4% | 12.4% |
| Interquartile 25% (IQ1) | 10.3% | 10.7% |
| Interquartile 75% (IQ3) | 15.2% | 18.7% |
| Interquartile Range (IQR) | 4.8% | 8.1% |
| Standard Deviation (Sample) | 6.4% | 14.7% |
| Standard Deviation (Population) | 6.3% | 14.5% |
Demographics Similar to Immigrants from Barbados and Macedonians by Single Male Poverty
In terms of single male poverty, the demographic groups most similar to Immigrants from Barbados are Puget Sound Salish (12.8%, a difference of 0.18%), Guyanese (12.8%, a difference of 0.31%), South African (12.8%, a difference of 0.33%), Danish (12.8%, a difference of 0.34%), and Immigrants from St. Vincent and the Grenadines (12.8%, a difference of 0.36%). Similarly, the demographic groups most similar to Macedonians are Immigrants from Kuwait (12.9%, a difference of 0.020%), Norwegian (12.9%, a difference of 0.030%), Nigerian (12.9%, a difference of 0.030%), Immigrants from Trinidad and Tobago (12.9%, a difference of 0.060%), and Immigrants from West Indies (12.9%, a difference of 0.090%).
| Demographics | Rating | Rank | Single Male Poverty |
| Immigrants | Barbados | 57.7 /100 | #168 | Average 12.7% |
| Puget Sound Salish | 54.3 /100 | #169 | Average 12.8% |
| Guyanese | 52.0 /100 | #170 | Average 12.8% |
| South Africans | 51.5 /100 | #171 | Average 12.8% |
| Danes | 51.4 /100 | #172 | Average 12.8% |
| Immigrants | St. Vincent and the Grenadines | 50.9 /100 | #173 | Average 12.8% |
| Costa Ricans | 50.0 /100 | #174 | Average 12.8% |
| Croatians | 48.9 /100 | #175 | Average 12.8% |
| Syrians | 48.4 /100 | #176 | Average 12.8% |
| Immigrants | Canada | 44.8 /100 | #177 | Average 12.8% |
| Immigrants | Switzerland | 43.1 /100 | #178 | Average 12.8% |
| Israelis | 41.0 /100 | #179 | Average 12.9% |
| Immigrants | North America | 37.7 /100 | #180 | Fair 12.9% |
| Panamanians | 37.6 /100 | #181 | Fair 12.9% |
| Moroccans | 36.8 /100 | #182 | Fair 12.9% |
| Immigrants | West Indies | 33.0 /100 | #183 | Fair 12.9% |
| Immigrants | Trinidad and Tobago | 32.5 /100 | #184 | Fair 12.9% |
| Norwegians | 32.0 /100 | #185 | Fair 12.9% |
| Nigerians | 31.9 /100 | #186 | Fair 12.9% |
| Immigrants | Kuwait | 31.9 /100 | #187 | Fair 12.9% |
| Macedonians | 31.5 /100 | #188 | Fair 12.9% |