Immigrants from Barbados vs Finnish Median Female Earnings
COMPARE
Immigrants from Barbados
Finnish
Median Female Earnings
Median Female Earnings Comparison
Immigrants from Barbados
Finns
$41,685
MEDIAN FEMALE EARNINGS
98.4/ 100
METRIC RATING
99th/ 347
METRIC RANK
$38,173
MEDIAN FEMALE EARNINGS
4.0/ 100
METRIC RATING
240th/ 347
METRIC RANK
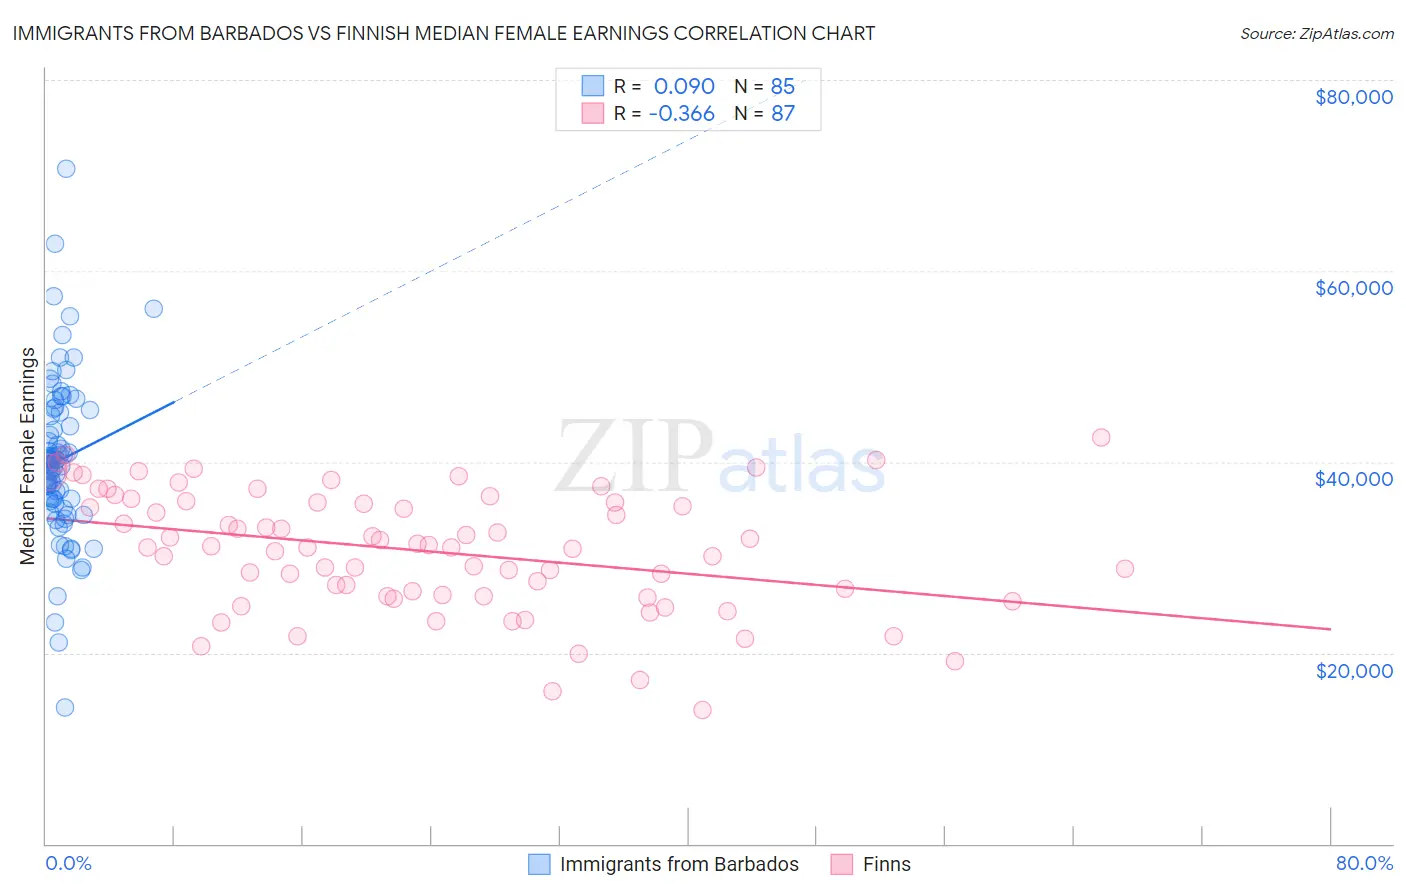
Immigrants from Barbados vs Finnish Median Female Earnings Correlation Chart
The statistical analysis conducted on geographies consisting of 112,771,231 people shows a slight positive correlation between the proportion of Immigrants from Barbados and median female earnings in the United States with a correlation coefficient (R) of 0.090 and weighted average of $41,685. Similarly, the statistical analysis conducted on geographies consisting of 404,382,146 people shows a mild negative correlation between the proportion of Finns and median female earnings in the United States with a correlation coefficient (R) of -0.366 and weighted average of $38,173, a difference of 9.2%.
Median Female Earnings Correlation Summary
| Measurement | Immigrants from Barbados | Finnish |
| Minimum | $14,324 | $14,000 |
| Maximum | $70,712 | $42,614 |
| Range | $56,388 | $28,614 |
| Mean | $40,171 | $30,656 |
| Median | $40,011 | $31,094 |
| Interquartile 25% (IQ1) | $35,731 | $25,915 |
| Interquartile 75% (IQ3) | $45,302 | $35,736 |
| Interquartile Range (IQR) | $9,570 | $9,822 |
| Standard Deviation (Sample) | $8,566 | $6,298 |
| Standard Deviation (Population) | $8,515 | $6,261 |
Similar Demographics by Median Female Earnings
Demographics Similar to Immigrants from Barbados by Median Female Earnings
In terms of median female earnings, the demographic groups most similar to Immigrants from Barbados are Romanian ($41,663, a difference of 0.050%), Immigrants from Fiji ($41,656, a difference of 0.070%), Immigrants from Poland ($41,630, a difference of 0.13%), Immigrants from Scotland ($41,771, a difference of 0.21%), and Immigrants from Argentina ($41,554, a difference of 0.31%).
| Demographics | Rating | Rank | Median Female Earnings |
| Argentineans | 99.1 /100 | #92 | Exceptional $41,952 |
| Immigrants | Grenada | 99.0 /100 | #93 | Exceptional $41,932 |
| Moroccans | 98.9 /100 | #94 | Exceptional $41,872 |
| Immigrants | Netherlands | 98.9 /100 | #95 | Exceptional $41,870 |
| South Africans | 98.8 /100 | #96 | Exceptional $41,825 |
| Immigrants | Hungary | 98.8 /100 | #97 | Exceptional $41,820 |
| Immigrants | Scotland | 98.7 /100 | #98 | Exceptional $41,771 |
| Immigrants | Barbados | 98.4 /100 | #99 | Exceptional $41,685 |
| Romanians | 98.3 /100 | #100 | Exceptional $41,663 |
| Immigrants | Fiji | 98.3 /100 | #101 | Exceptional $41,656 |
| Immigrants | Poland | 98.2 /100 | #102 | Exceptional $41,630 |
| Immigrants | Argentina | 97.9 /100 | #103 | Exceptional $41,554 |
| Immigrants | Zimbabwe | 97.8 /100 | #104 | Exceptional $41,527 |
| Italians | 97.7 /100 | #105 | Exceptional $41,505 |
| Immigrants | Eritrea | 97.6 /100 | #106 | Exceptional $41,485 |
Demographics Similar to Finns by Median Female Earnings
In terms of median female earnings, the demographic groups most similar to Finns are English ($38,196, a difference of 0.060%), Alaska Native ($38,202, a difference of 0.080%), Immigrants from Cabo Verde ($38,208, a difference of 0.090%), Sudanese ($38,215, a difference of 0.11%), and Liberian ($38,215, a difference of 0.11%).
| Demographics | Rating | Rank | Median Female Earnings |
| Tongans | 5.1 /100 | #233 | Tragic $38,288 |
| Celtics | 5.0 /100 | #234 | Tragic $38,283 |
| Sudanese | 4.4 /100 | #235 | Tragic $38,215 |
| Liberians | 4.4 /100 | #236 | Tragic $38,215 |
| Immigrants | Cabo Verde | 4.3 /100 | #237 | Tragic $38,208 |
| Alaska Natives | 4.3 /100 | #238 | Tragic $38,202 |
| English | 4.2 /100 | #239 | Tragic $38,196 |
| Finns | 4.0 /100 | #240 | Tragic $38,173 |
| Spanish | 3.5 /100 | #241 | Tragic $38,098 |
| Immigrants | Burma/Myanmar | 3.0 /100 | #242 | Tragic $38,028 |
| Germans | 2.8 /100 | #243 | Tragic $37,986 |
| Immigrants | Liberia | 2.7 /100 | #244 | Tragic $37,970 |
| Immigrants | Middle Africa | 2.7 /100 | #245 | Tragic $37,965 |
| Delaware | 2.6 /100 | #246 | Tragic $37,964 |
| Immigrants | Somalia | 2.4 /100 | #247 | Tragic $37,914 |