Immigrants from Europe vs Scotch-Irish Median Household Income
COMPARE
Immigrants from Europe
Scotch-Irish
Median Household Income
Median Household Income Comparison
Immigrants from Europe
Scotch-Irish
$95,032
MEDIAN HOUSEHOLD INCOME
99.8/ 100
METRIC RATING
59th/ 347
METRIC RANK
$80,972
MEDIAN HOUSEHOLD INCOME
6.6/ 100
METRIC RATING
225th/ 347
METRIC RANK
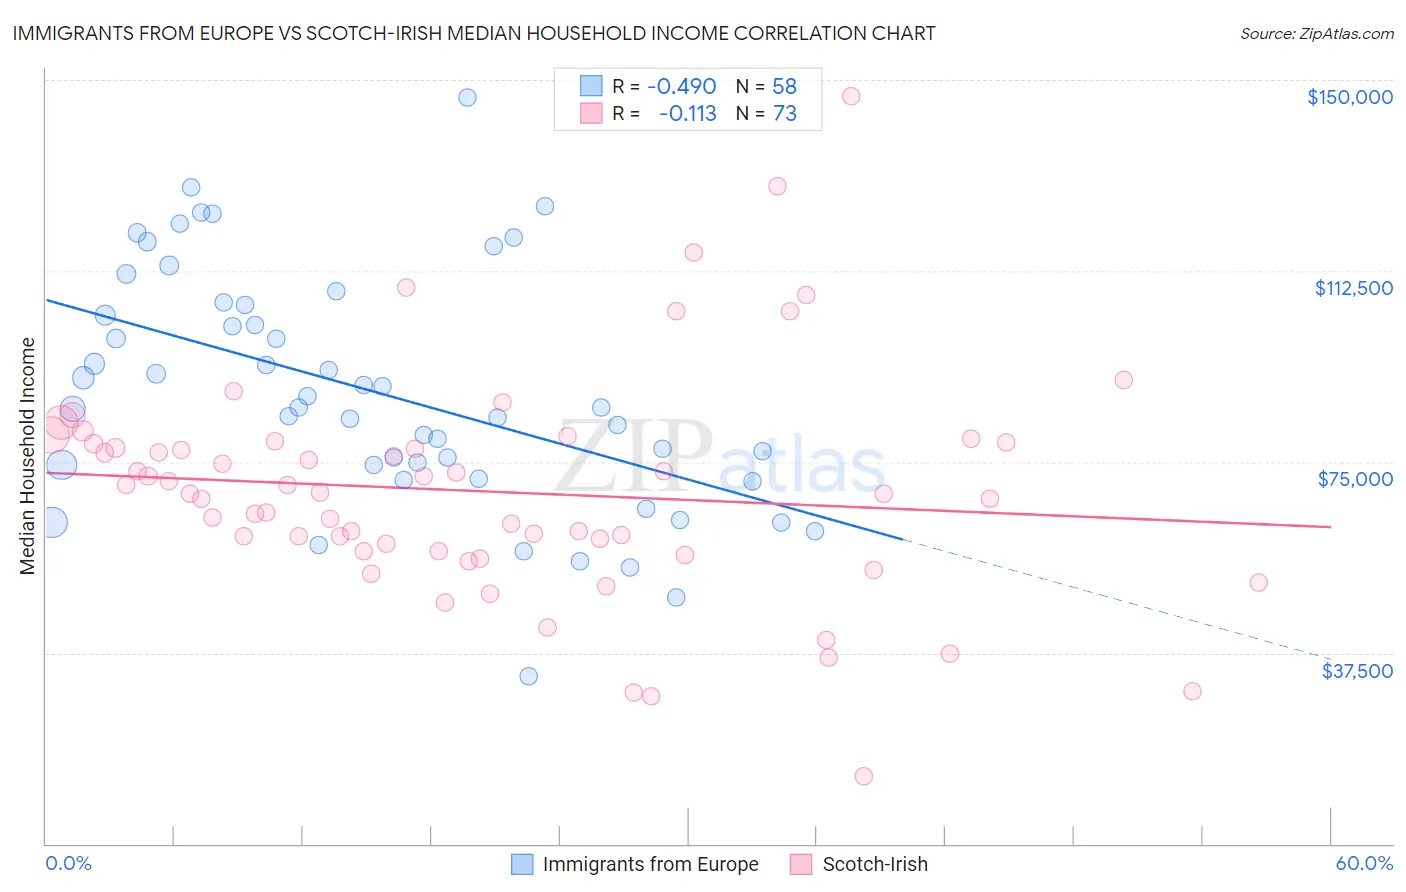
Immigrants from Europe vs Scotch-Irish Median Household Income Correlation Chart
The statistical analysis conducted on geographies consisting of 546,586,899 people shows a moderate negative correlation between the proportion of Immigrants from Europe and median household income in the United States with a correlation coefficient (R) of -0.490 and weighted average of $95,032. Similarly, the statistical analysis conducted on geographies consisting of 548,026,119 people shows a poor negative correlation between the proportion of Scotch-Irish and median household income in the United States with a correlation coefficient (R) of -0.113 and weighted average of $80,972, a difference of 17.4%.
Median Household Income Correlation Summary
| Measurement | Immigrants from Europe | Scotch-Irish |
| Minimum | $32,853 | $13,333 |
| Maximum | $146,675 | $146,875 |
| Range | $113,822 | $133,542 |
| Mean | $88,761 | $69,187 |
| Median | $85,626 | $68,778 |
| Interquartile 25% (IQ1) | $74,349 | $57,401 |
| Interquartile 75% (IQ3) | $105,928 | $78,673 |
| Interquartile Range (IQR) | $31,579 | $21,272 |
| Standard Deviation (Sample) | $23,344 | $22,180 |
| Standard Deviation (Population) | $23,142 | $22,027 |
Similar Demographics by Median Household Income
Demographics Similar to Immigrants from Europe by Median Household Income
In terms of median household income, the demographic groups most similar to Immigrants from Europe are Korean ($95,018, a difference of 0.020%), Laotian ($94,990, a difference of 0.040%), Soviet Union ($95,098, a difference of 0.070%), New Zealander ($95,146, a difference of 0.12%), and Immigrants from Norway ($94,846, a difference of 0.20%).
| Demographics | Rating | Rank | Median Household Income |
| Immigrants | South Africa | 99.9 /100 | #52 | Exceptional $95,800 |
| Paraguayans | 99.9 /100 | #53 | Exceptional $95,737 |
| Egyptians | 99.9 /100 | #54 | Exceptional $95,673 |
| Immigrants | Czechoslovakia | 99.9 /100 | #55 | Exceptional $95,319 |
| Immigrants | Austria | 99.9 /100 | #56 | Exceptional $95,277 |
| New Zealanders | 99.8 /100 | #57 | Exceptional $95,146 |
| Soviet Union | 99.8 /100 | #58 | Exceptional $95,098 |
| Immigrants | Europe | 99.8 /100 | #59 | Exceptional $95,032 |
| Koreans | 99.8 /100 | #60 | Exceptional $95,018 |
| Laotians | 99.8 /100 | #61 | Exceptional $94,990 |
| Immigrants | Norway | 99.8 /100 | #62 | Exceptional $94,846 |
| Greeks | 99.8 /100 | #63 | Exceptional $94,735 |
| Immigrants | Netherlands | 99.7 /100 | #64 | Exceptional $94,411 |
| Immigrants | Belarus | 99.7 /100 | #65 | Exceptional $94,399 |
| Immigrants | Romania | 99.7 /100 | #66 | Exceptional $94,222 |
Demographics Similar to Scotch-Irish by Median Household Income
In terms of median household income, the demographic groups most similar to Scotch-Irish are Malaysian ($81,064, a difference of 0.11%), Immigrants from Panama ($80,873, a difference of 0.12%), Guyanese ($80,734, a difference of 0.29%), Immigrants from El Salvador ($81,213, a difference of 0.30%), and Immigrants from Bangladesh ($80,722, a difference of 0.31%).
| Demographics | Rating | Rank | Median Household Income |
| Whites/Caucasians | 12.2 /100 | #218 | Poor $82,029 |
| Nigerians | 10.3 /100 | #219 | Poor $81,725 |
| Immigrants | Venezuela | 9.0 /100 | #220 | Tragic $81,506 |
| Immigrants | Ghana | 9.0 /100 | #221 | Tragic $81,489 |
| Immigrants | Nigeria | 7.7 /100 | #222 | Tragic $81,236 |
| Immigrants | El Salvador | 7.6 /100 | #223 | Tragic $81,213 |
| Malaysians | 7.0 /100 | #224 | Tragic $81,064 |
| Scotch-Irish | 6.6 /100 | #225 | Tragic $80,972 |
| Immigrants | Panama | 6.2 /100 | #226 | Tragic $80,873 |
| Guyanese | 5.7 /100 | #227 | Tragic $80,734 |
| Immigrants | Bangladesh | 5.7 /100 | #228 | Tragic $80,722 |
| Delaware | 5.0 /100 | #229 | Tragic $80,527 |
| Bermudans | 4.7 /100 | #230 | Tragic $80,406 |
| Trinidadians and Tobagonians | 4.7 /100 | #231 | Tragic $80,402 |
| Immigrants | Trinidad and Tobago | 4.6 /100 | #232 | Tragic $80,373 |