Immigrants from Bahamas vs Immigrants from Eastern Africa Median Female Earnings
COMPARE
Immigrants from Bahamas
Immigrants from Eastern Africa
Median Female Earnings
Median Female Earnings Comparison
Immigrants from Bahamas
Immigrants from Eastern Africa
$35,027
MEDIAN FEMALE EARNINGS
0.0/ 100
METRIC RATING
308th/ 347
METRIC RANK
$40,644
MEDIAN FEMALE EARNINGS
87.7/ 100
METRIC RATING
136th/ 347
METRIC RANK
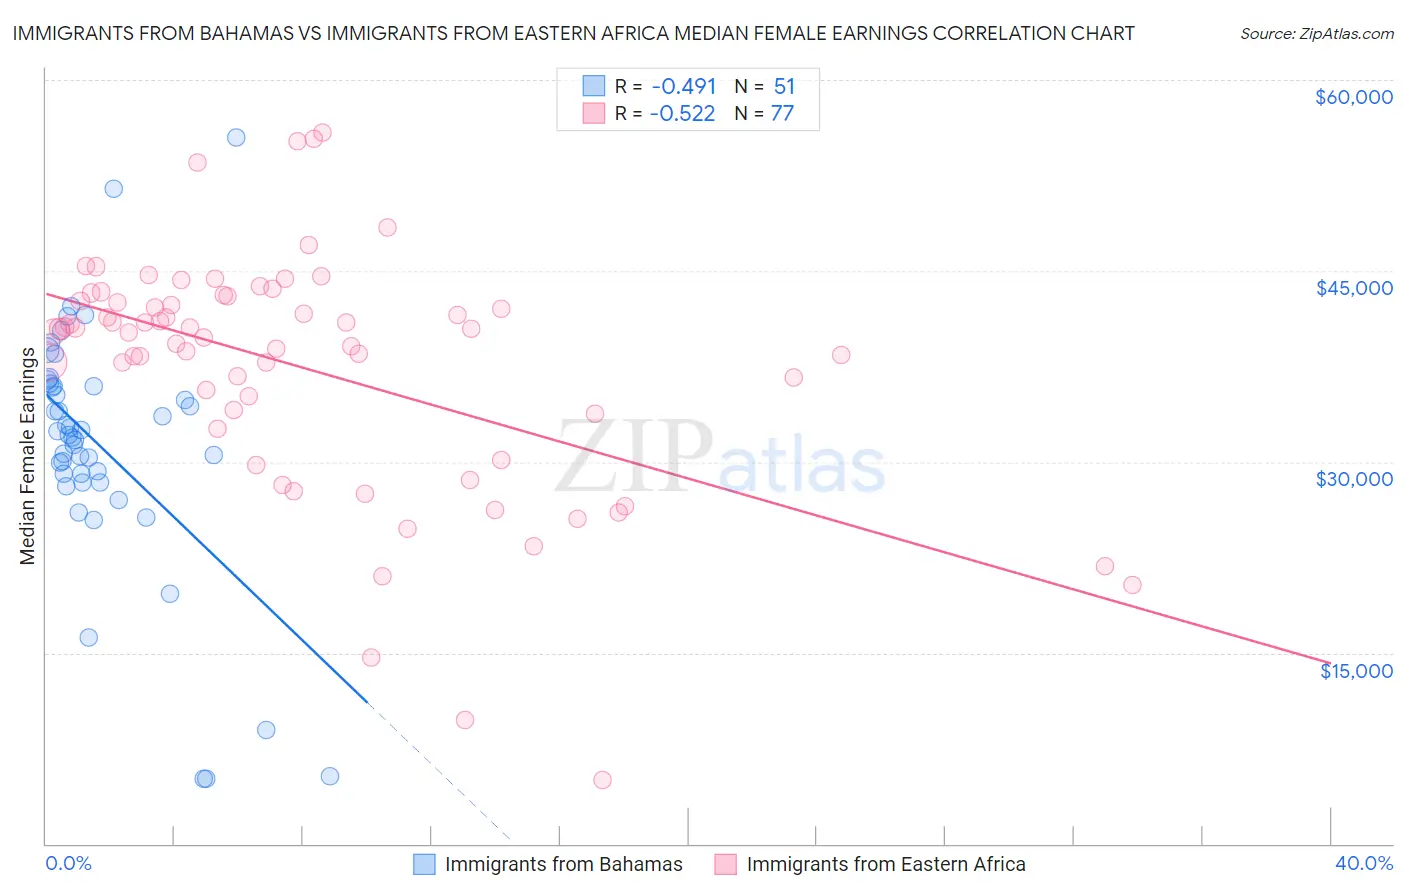
Immigrants from Bahamas vs Immigrants from Eastern Africa Median Female Earnings Correlation Chart
The statistical analysis conducted on geographies consisting of 104,633,712 people shows a moderate negative correlation between the proportion of Immigrants from Bahamas and median female earnings in the United States with a correlation coefficient (R) of -0.491 and weighted average of $35,027. Similarly, the statistical analysis conducted on geographies consisting of 355,081,217 people shows a substantial negative correlation between the proportion of Immigrants from Eastern Africa and median female earnings in the United States with a correlation coefficient (R) of -0.522 and weighted average of $40,644, a difference of 16.0%.
Median Female Earnings Correlation Summary
| Measurement | Immigrants from Bahamas | Immigrants from Eastern Africa |
| Minimum | $5,063 | $5,000 |
| Maximum | $55,500 | $55,898 |
| Range | $50,437 | $50,898 |
| Mean | $31,145 | $37,373 |
| Median | $32,119 | $40,248 |
| Interquartile 25% (IQ1) | $28,361 | $33,197 |
| Interquartile 75% (IQ3) | $35,940 | $42,814 |
| Interquartile Range (IQR) | $7,579 | $9,617 |
| Standard Deviation (Sample) | $9,851 | $9,538 |
| Standard Deviation (Population) | $9,754 | $9,476 |
Similar Demographics by Median Female Earnings
Demographics Similar to Immigrants from Bahamas by Median Female Earnings
In terms of median female earnings, the demographic groups most similar to Immigrants from Bahamas are Honduran ($35,013, a difference of 0.040%), Chippewa ($35,003, a difference of 0.070%), Sioux ($35,063, a difference of 0.10%), Ute ($34,960, a difference of 0.19%), and Yaqui ($34,943, a difference of 0.24%).
| Demographics | Rating | Rank | Median Female Earnings |
| Pima | 0.0 /100 | #301 | Tragic $35,326 |
| Blacks/African Americans | 0.0 /100 | #302 | Tragic $35,315 |
| Immigrants | Latin America | 0.0 /100 | #303 | Tragic $35,307 |
| Crow | 0.0 /100 | #304 | Tragic $35,266 |
| Bahamians | 0.0 /100 | #305 | Tragic $35,125 |
| Fijians | 0.0 /100 | #306 | Tragic $35,114 |
| Sioux | 0.0 /100 | #307 | Tragic $35,063 |
| Immigrants | Bahamas | 0.0 /100 | #308 | Tragic $35,027 |
| Hondurans | 0.0 /100 | #309 | Tragic $35,013 |
| Chippewa | 0.0 /100 | #310 | Tragic $35,003 |
| Ute | 0.0 /100 | #311 | Tragic $34,960 |
| Yaqui | 0.0 /100 | #312 | Tragic $34,943 |
| Cubans | 0.0 /100 | #313 | Tragic $34,942 |
| Apache | 0.0 /100 | #314 | Tragic $34,895 |
| Pennsylvania Germans | 0.0 /100 | #315 | Tragic $34,802 |
Demographics Similar to Immigrants from Eastern Africa by Median Female Earnings
In terms of median female earnings, the demographic groups most similar to Immigrants from Eastern Africa are Pakistani ($40,596, a difference of 0.12%), Immigrants from Nepal ($40,704, a difference of 0.15%), Taiwanese ($40,576, a difference of 0.17%), Arab ($40,718, a difference of 0.18%), and Syrian ($40,727, a difference of 0.20%).
| Demographics | Rating | Rank | Median Female Earnings |
| Zimbabweans | 90.8 /100 | #129 | Exceptional $40,798 |
| Immigrants | Guyana | 90.3 /100 | #130 | Exceptional $40,773 |
| Chileans | 90.0 /100 | #131 | Exceptional $40,757 |
| Immigrants | Uganda | 89.7 /100 | #132 | Excellent $40,739 |
| Syrians | 89.5 /100 | #133 | Excellent $40,727 |
| Arabs | 89.3 /100 | #134 | Excellent $40,718 |
| Immigrants | Nepal | 89.0 /100 | #135 | Excellent $40,704 |
| Immigrants | Eastern Africa | 87.7 /100 | #136 | Excellent $40,644 |
| Pakistanis | 86.6 /100 | #137 | Excellent $40,596 |
| Taiwanese | 86.1 /100 | #138 | Excellent $40,576 |
| Immigrants | South Eastern Asia | 85.7 /100 | #139 | Excellent $40,558 |
| Serbians | 85.2 /100 | #140 | Excellent $40,539 |
| Immigrants | Syria | 84.1 /100 | #141 | Excellent $40,499 |
| Sri Lankans | 84.0 /100 | #142 | Excellent $40,496 |
| Northern Europeans | 83.9 /100 | #143 | Excellent $40,491 |