Immigrants from Bahamas vs Immigrants from Central America Median Female Earnings
COMPARE
Immigrants from Bahamas
Immigrants from Central America
Median Female Earnings
Median Female Earnings Comparison
Immigrants from Bahamas
Immigrants from Central America
$35,027
MEDIAN FEMALE EARNINGS
0.0/ 100
METRIC RATING
308th/ 347
METRIC RANK
$33,953
MEDIAN FEMALE EARNINGS
0.0/ 100
METRIC RATING
328th/ 347
METRIC RANK
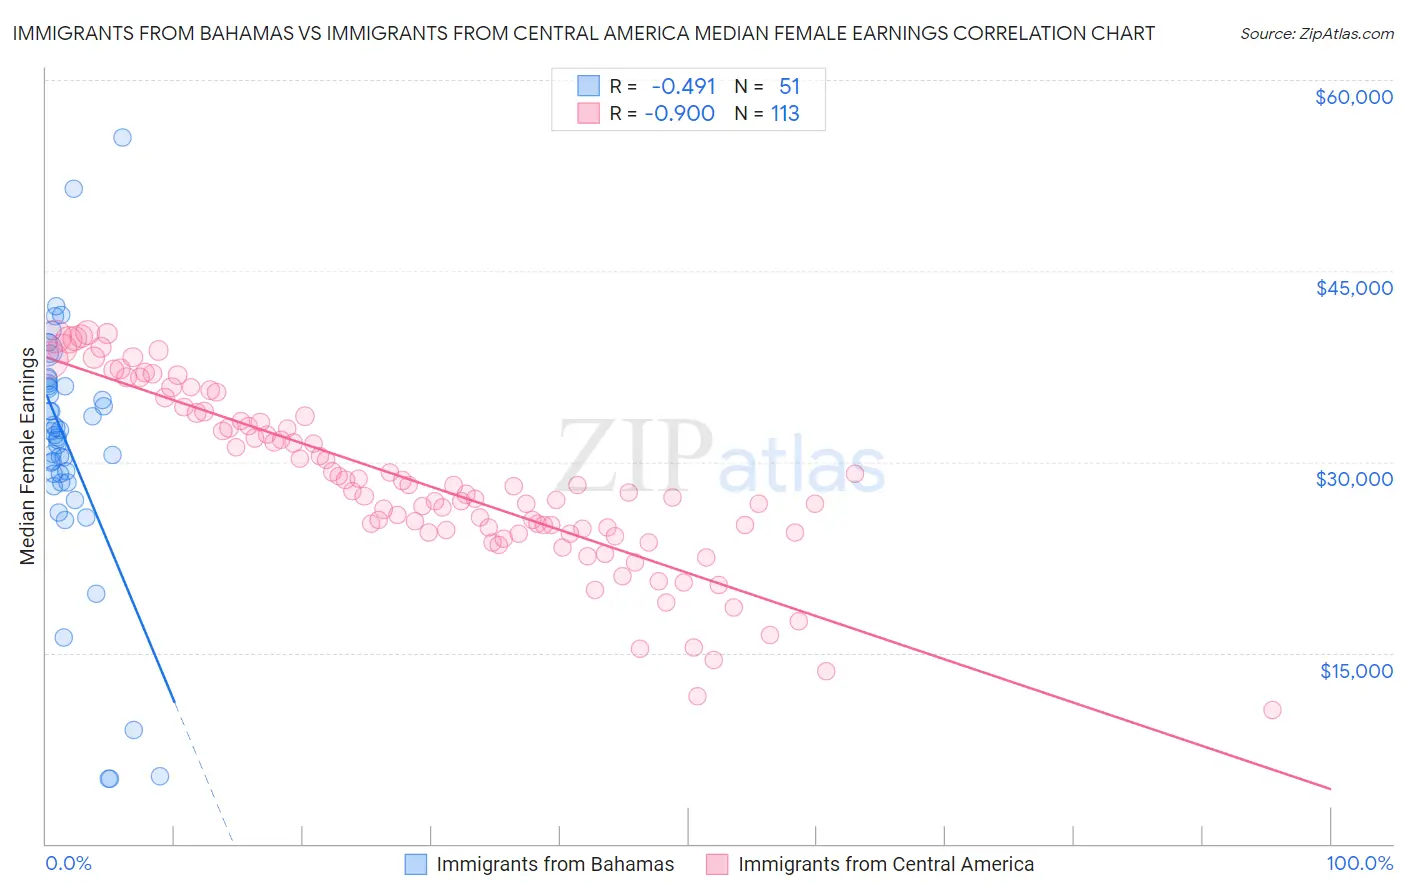
Immigrants from Bahamas vs Immigrants from Central America Median Female Earnings Correlation Chart
The statistical analysis conducted on geographies consisting of 104,633,712 people shows a moderate negative correlation between the proportion of Immigrants from Bahamas and median female earnings in the United States with a correlation coefficient (R) of -0.491 and weighted average of $35,027. Similarly, the statistical analysis conducted on geographies consisting of 535,445,485 people shows a near-perfect negative correlation between the proportion of Immigrants from Central America and median female earnings in the United States with a correlation coefficient (R) of -0.900 and weighted average of $33,953, a difference of 3.2%.
Median Female Earnings Correlation Summary
| Measurement | Immigrants from Bahamas | Immigrants from Central America |
| Minimum | $5,063 | $10,532 |
| Maximum | $55,500 | $40,138 |
| Range | $50,437 | $29,606 |
| Mean | $31,145 | $28,383 |
| Median | $32,119 | $27,631 |
| Interquartile 25% (IQ1) | $28,361 | $24,472 |
| Interquartile 75% (IQ3) | $35,940 | $33,368 |
| Interquartile Range (IQR) | $7,579 | $8,895 |
| Standard Deviation (Sample) | $9,851 | $6,771 |
| Standard Deviation (Population) | $9,754 | $6,741 |
Demographics Similar to Immigrants from Bahamas and Immigrants from Central America by Median Female Earnings
In terms of median female earnings, the demographic groups most similar to Immigrants from Bahamas are Honduran ($35,013, a difference of 0.040%), Chippewa ($35,003, a difference of 0.070%), Ute ($34,960, a difference of 0.19%), Yaqui ($34,943, a difference of 0.24%), and Cuban ($34,942, a difference of 0.24%). Similarly, the demographic groups most similar to Immigrants from Central America are Cajun ($34,034, a difference of 0.24%), Kiowa ($34,074, a difference of 0.36%), Dutch West Indian ($34,106, a difference of 0.45%), Immigrants from Congo ($34,317, a difference of 1.1%), and Seminole ($34,385, a difference of 1.3%).
| Demographics | Rating | Rank | Median Female Earnings |
| Immigrants | Bahamas | 0.0 /100 | #308 | Tragic $35,027 |
| Hondurans | 0.0 /100 | #309 | Tragic $35,013 |
| Chippewa | 0.0 /100 | #310 | Tragic $35,003 |
| Ute | 0.0 /100 | #311 | Tragic $34,960 |
| Yaqui | 0.0 /100 | #312 | Tragic $34,943 |
| Cubans | 0.0 /100 | #313 | Tragic $34,942 |
| Apache | 0.0 /100 | #314 | Tragic $34,895 |
| Pennsylvania Germans | 0.0 /100 | #315 | Tragic $34,802 |
| Cherokee | 0.0 /100 | #316 | Tragic $34,742 |
| Potawatomi | 0.0 /100 | #317 | Tragic $34,739 |
| Immigrants | Yemen | 0.0 /100 | #318 | Tragic $34,693 |
| Shoshone | 0.0 /100 | #319 | Tragic $34,677 |
| Immigrants | Honduras | 0.0 /100 | #320 | Tragic $34,647 |
| Hispanics or Latinos | 0.0 /100 | #321 | Tragic $34,421 |
| Chickasaw | 0.0 /100 | #322 | Tragic $34,414 |
| Seminole | 0.0 /100 | #323 | Tragic $34,385 |
| Immigrants | Congo | 0.0 /100 | #324 | Tragic $34,317 |
| Dutch West Indians | 0.0 /100 | #325 | Tragic $34,106 |
| Kiowa | 0.0 /100 | #326 | Tragic $34,074 |
| Cajuns | 0.0 /100 | #327 | Tragic $34,034 |
| Immigrants | Central America | 0.0 /100 | #328 | Tragic $33,953 |