Immigrants from Bahamas vs Ottawa Median Female Earnings
COMPARE
Immigrants from Bahamas
Ottawa
Median Female Earnings
Median Female Earnings Comparison
Immigrants from Bahamas
Ottawa
$35,027
MEDIAN FEMALE EARNINGS
0.0/ 100
METRIC RATING
308th/ 347
METRIC RANK
$33,378
MEDIAN FEMALE EARNINGS
0.0/ 100
METRIC RATING
336th/ 347
METRIC RANK
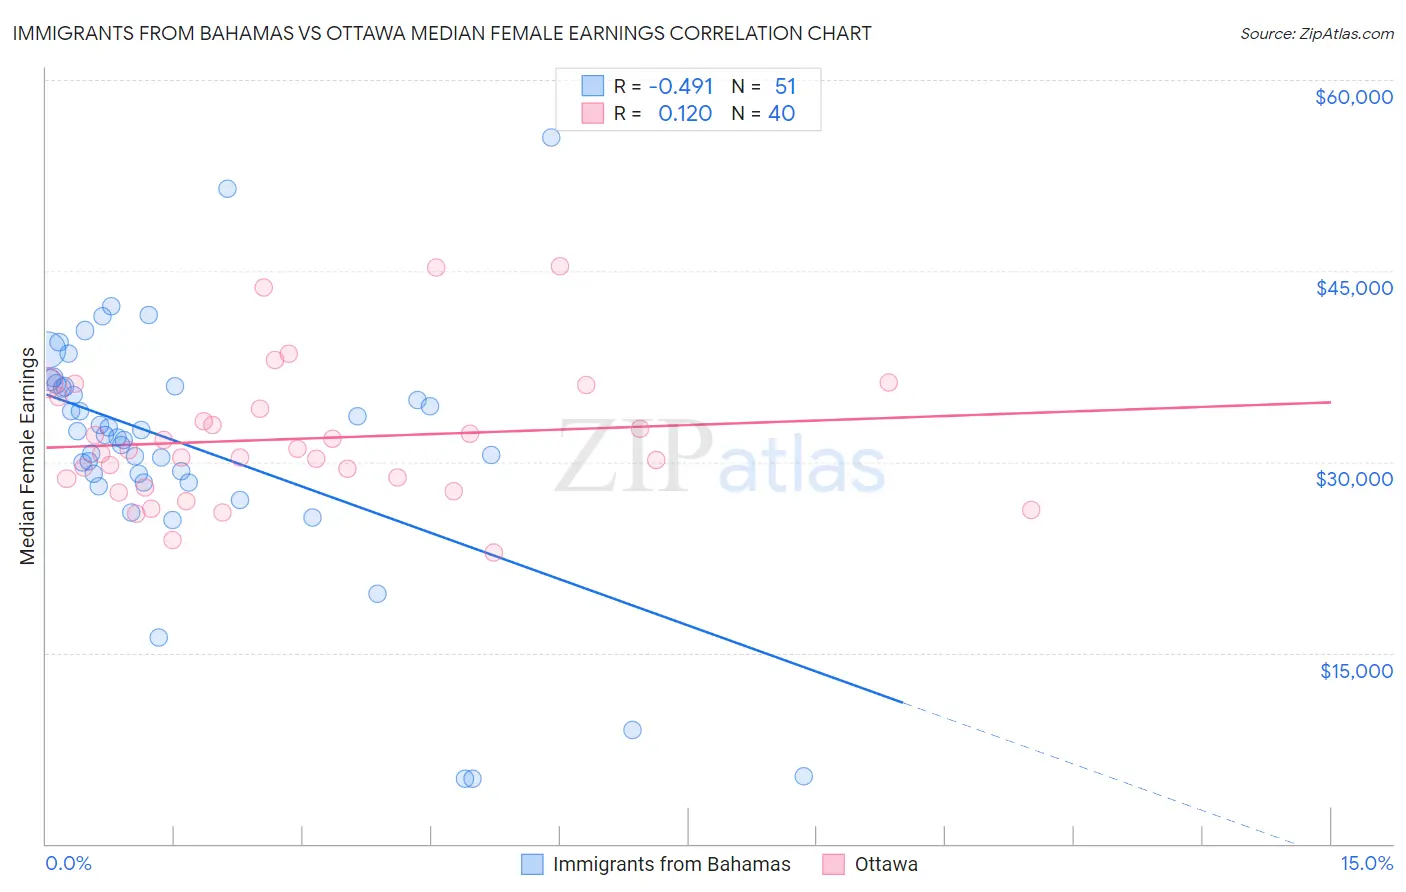
Immigrants from Bahamas vs Ottawa Median Female Earnings Correlation Chart
The statistical analysis conducted on geographies consisting of 104,633,712 people shows a moderate negative correlation between the proportion of Immigrants from Bahamas and median female earnings in the United States with a correlation coefficient (R) of -0.491 and weighted average of $35,027. Similarly, the statistical analysis conducted on geographies consisting of 49,946,188 people shows a poor positive correlation between the proportion of Ottawa and median female earnings in the United States with a correlation coefficient (R) of 0.120 and weighted average of $33,378, a difference of 4.9%.
Median Female Earnings Correlation Summary
| Measurement | Immigrants from Bahamas | Ottawa |
| Minimum | $5,063 | $22,891 |
| Maximum | $55,500 | $45,375 |
| Range | $50,437 | $22,484 |
| Mean | $31,145 | $31,817 |
| Median | $32,119 | $30,771 |
| Interquartile 25% (IQ1) | $28,361 | $28,352 |
| Interquartile 75% (IQ3) | $35,940 | $34,654 |
| Interquartile Range (IQR) | $7,579 | $6,302 |
| Standard Deviation (Sample) | $9,851 | $5,248 |
| Standard Deviation (Population) | $9,754 | $5,182 |
Similar Demographics by Median Female Earnings
Demographics Similar to Immigrants from Bahamas by Median Female Earnings
In terms of median female earnings, the demographic groups most similar to Immigrants from Bahamas are Honduran ($35,013, a difference of 0.040%), Chippewa ($35,003, a difference of 0.070%), Sioux ($35,063, a difference of 0.10%), Ute ($34,960, a difference of 0.19%), and Yaqui ($34,943, a difference of 0.24%).
| Demographics | Rating | Rank | Median Female Earnings |
| Pima | 0.0 /100 | #301 | Tragic $35,326 |
| Blacks/African Americans | 0.0 /100 | #302 | Tragic $35,315 |
| Immigrants | Latin America | 0.0 /100 | #303 | Tragic $35,307 |
| Crow | 0.0 /100 | #304 | Tragic $35,266 |
| Bahamians | 0.0 /100 | #305 | Tragic $35,125 |
| Fijians | 0.0 /100 | #306 | Tragic $35,114 |
| Sioux | 0.0 /100 | #307 | Tragic $35,063 |
| Immigrants | Bahamas | 0.0 /100 | #308 | Tragic $35,027 |
| Hondurans | 0.0 /100 | #309 | Tragic $35,013 |
| Chippewa | 0.0 /100 | #310 | Tragic $35,003 |
| Ute | 0.0 /100 | #311 | Tragic $34,960 |
| Yaqui | 0.0 /100 | #312 | Tragic $34,943 |
| Cubans | 0.0 /100 | #313 | Tragic $34,942 |
| Apache | 0.0 /100 | #314 | Tragic $34,895 |
| Pennsylvania Germans | 0.0 /100 | #315 | Tragic $34,802 |
Demographics Similar to Ottawa by Median Female Earnings
In terms of median female earnings, the demographic groups most similar to Ottawa are Yakama ($33,354, a difference of 0.070%), Creek ($33,437, a difference of 0.18%), Immigrants from Cuba ($33,291, a difference of 0.26%), Immigrants from Mexico ($33,236, a difference of 0.43%), and Tohono O'odham ($33,205, a difference of 0.52%).
| Demographics | Rating | Rank | Median Female Earnings |
| Hopi | 0.0 /100 | #329 | Tragic $33,932 |
| Menominee | 0.0 /100 | #330 | Tragic $33,894 |
| Natives/Alaskans | 0.0 /100 | #331 | Tragic $33,806 |
| Choctaw | 0.0 /100 | #332 | Tragic $33,775 |
| Mexicans | 0.0 /100 | #333 | Tragic $33,664 |
| Spanish American Indians | 0.0 /100 | #334 | Tragic $33,625 |
| Creek | 0.0 /100 | #335 | Tragic $33,437 |
| Ottawa | 0.0 /100 | #336 | Tragic $33,378 |
| Yakama | 0.0 /100 | #337 | Tragic $33,354 |
| Immigrants | Cuba | 0.0 /100 | #338 | Tragic $33,291 |
| Immigrants | Mexico | 0.0 /100 | #339 | Tragic $33,236 |
| Tohono O'odham | 0.0 /100 | #340 | Tragic $33,205 |
| Navajo | 0.0 /100 | #341 | Tragic $33,046 |
| Yup'ik | 0.0 /100 | #342 | Tragic $32,730 |
| Pueblo | 0.0 /100 | #343 | Tragic $32,564 |