Immigrants from Austria vs Immigrants from Thailand Householder Income Ages 45 - 64 years
COMPARE
Immigrants from Austria
Immigrants from Thailand
Householder Income Ages 45 - 64 years
Householder Income Ages 45 - 64 years Comparison
Immigrants from Austria
Immigrants from Thailand
$113,140
HOUSEHOLDER INCOME AGES 45 - 64 YEARS
99.8/ 100
METRIC RATING
50th/ 347
METRIC RANK
$97,400
HOUSEHOLDER INCOME AGES 45 - 64 YEARS
18.8/ 100
METRIC RATING
203rd/ 347
METRIC RANK
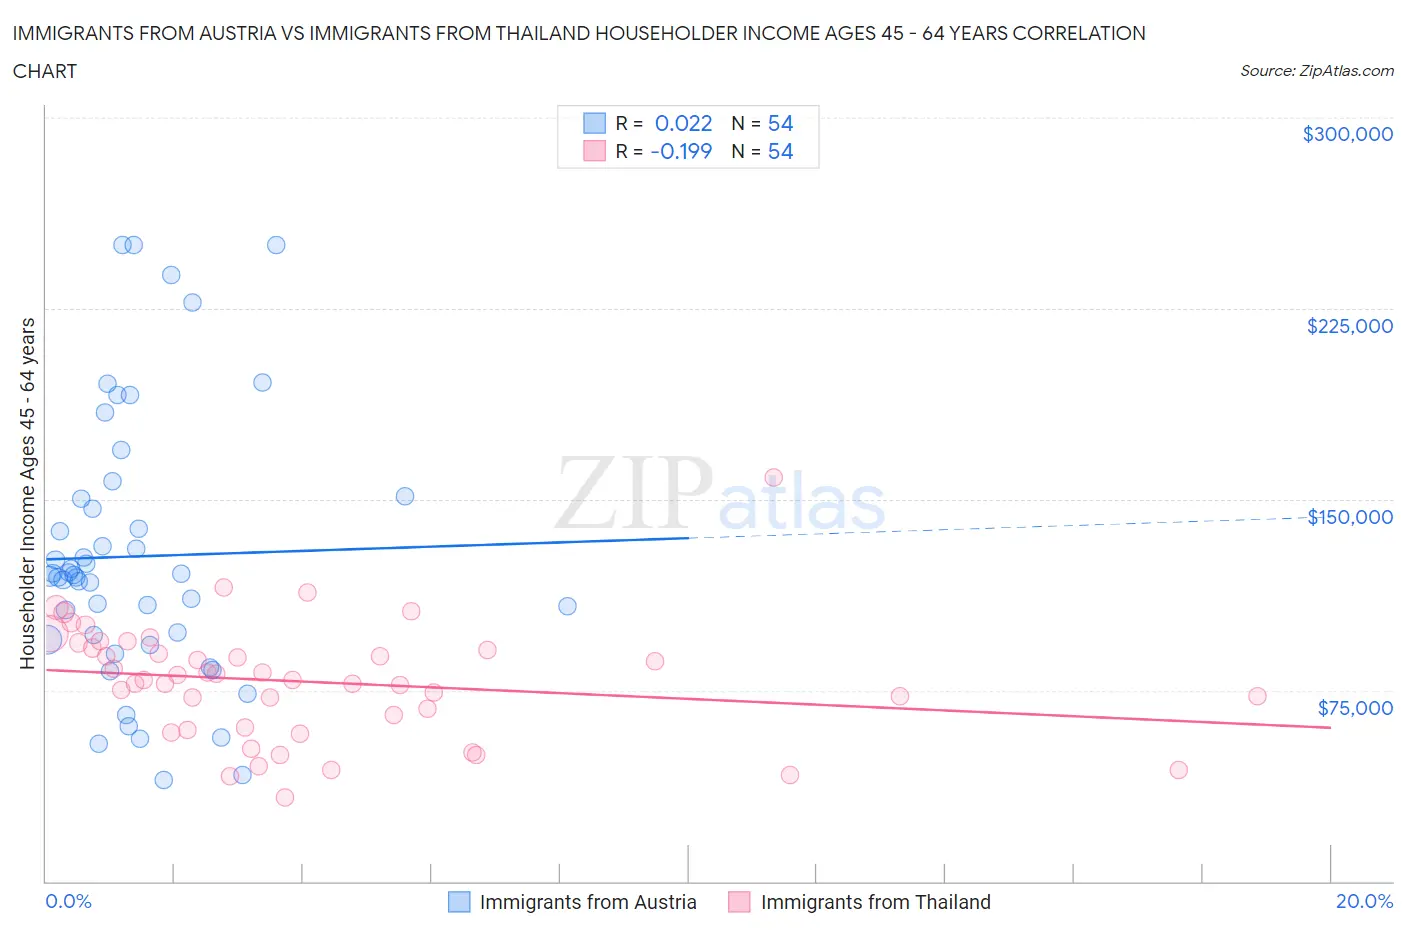
Immigrants from Austria vs Immigrants from Thailand Householder Income Ages 45 - 64 years Correlation Chart
The statistical analysis conducted on geographies consisting of 167,924,064 people shows no correlation between the proportion of Immigrants from Austria and household income with householder between the ages 45 and 64 in the United States with a correlation coefficient (R) of 0.022 and weighted average of $113,140. Similarly, the statistical analysis conducted on geographies consisting of 316,747,183 people shows a poor negative correlation between the proportion of Immigrants from Thailand and household income with householder between the ages 45 and 64 in the United States with a correlation coefficient (R) of -0.199 and weighted average of $97,400, a difference of 16.2%.
Householder Income Ages 45 - 64 years Correlation Summary
| Measurement | Immigrants from Austria | Immigrants from Thailand |
| Minimum | $39,554 | $32,910 |
| Maximum | $250,001 | $158,417 |
| Range | $210,447 | $125,507 |
| Mean | $127,653 | $78,332 |
| Median | $120,029 | $78,883 |
| Interquartile 25% (IQ1) | $95,004 | $60,388 |
| Interquartile 75% (IQ3) | $150,192 | $91,575 |
| Interquartile Range (IQR) | $55,187 | $31,186 |
| Standard Deviation (Sample) | $52,842 | $23,014 |
| Standard Deviation (Population) | $52,351 | $22,800 |
Similar Demographics by Householder Income Ages 45 - 64 years
Demographics Similar to Immigrants from Austria by Householder Income Ages 45 - 64 years
In terms of householder income ages 45 - 64 years, the demographic groups most similar to Immigrants from Austria are Immigrants from Russia ($113,215, a difference of 0.070%), Immigrants from South Africa ($112,886, a difference of 0.22%), Immigrants from Malaysia ($112,796, a difference of 0.30%), Immigrants from Indonesia ($113,519, a difference of 0.34%), and Australian ($113,533, a difference of 0.35%).
| Demographics | Rating | Rank | Householder Income Ages 45 - 64 years |
| Israelis | 99.9 /100 | #43 | Exceptional $114,186 |
| Bulgarians | 99.9 /100 | #44 | Exceptional $113,883 |
| Immigrants | France | 99.9 /100 | #45 | Exceptional $113,680 |
| Immigrants | Greece | 99.9 /100 | #46 | Exceptional $113,548 |
| Australians | 99.9 /100 | #47 | Exceptional $113,533 |
| Immigrants | Indonesia | 99.9 /100 | #48 | Exceptional $113,519 |
| Immigrants | Russia | 99.8 /100 | #49 | Exceptional $113,215 |
| Immigrants | Austria | 99.8 /100 | #50 | Exceptional $113,140 |
| Immigrants | South Africa | 99.8 /100 | #51 | Exceptional $112,886 |
| Immigrants | Malaysia | 99.8 /100 | #52 | Exceptional $112,796 |
| Afghans | 99.8 /100 | #53 | Exceptional $112,676 |
| Greeks | 99.8 /100 | #54 | Exceptional $112,630 |
| Lithuanians | 99.8 /100 | #55 | Exceptional $112,484 |
| Egyptians | 99.7 /100 | #56 | Exceptional $112,256 |
| Immigrants | Scotland | 99.7 /100 | #57 | Exceptional $112,175 |
Demographics Similar to Immigrants from Thailand by Householder Income Ages 45 - 64 years
In terms of householder income ages 45 - 64 years, the demographic groups most similar to Immigrants from Thailand are Tlingit-Haida ($97,417, a difference of 0.020%), Immigrants from Eritrea ($97,373, a difference of 0.030%), Immigrants from Colombia ($97,290, a difference of 0.11%), Immigrants from Africa ($97,284, a difference of 0.12%), and Ghanaian ($97,277, a difference of 0.13%).
| Demographics | Rating | Rank | Householder Income Ages 45 - 64 years |
| Immigrants | Eastern Africa | 28.3 /100 | #196 | Fair $98,467 |
| Puget Sound Salish | 27.0 /100 | #197 | Fair $98,340 |
| Immigrants | Iraq | 25.7 /100 | #198 | Fair $98,201 |
| Whites/Caucasians | 24.6 /100 | #199 | Fair $98,091 |
| Immigrants | Kenya | 23.5 /100 | #200 | Fair $97,964 |
| Yugoslavians | 20.0 /100 | #201 | Fair $97,558 |
| Tlingit-Haida | 18.9 /100 | #202 | Poor $97,417 |
| Immigrants | Thailand | 18.8 /100 | #203 | Poor $97,400 |
| Immigrants | Eritrea | 18.6 /100 | #204 | Poor $97,373 |
| Immigrants | Colombia | 18.0 /100 | #205 | Poor $97,290 |
| Immigrants | Africa | 17.9 /100 | #206 | Poor $97,284 |
| Ghanaians | 17.9 /100 | #207 | Poor $97,277 |
| Scotch-Irish | 16.4 /100 | #208 | Poor $97,073 |
| Japanese | 14.8 /100 | #209 | Poor $96,834 |
| Tsimshian | 14.5 /100 | #210 | Poor $96,783 |