Immigrants from Austria vs Filipino Median Female Earnings
COMPARE
Immigrants from Austria
Filipino
Median Female Earnings
Median Female Earnings Comparison
Immigrants from Austria
Filipinos
$42,824
MEDIAN FEMALE EARNINGS
99.8/ 100
METRIC RATING
68th/ 347
METRIC RANK
$49,508
MEDIAN FEMALE EARNINGS
100.0/ 100
METRIC RATING
2nd/ 347
METRIC RANK
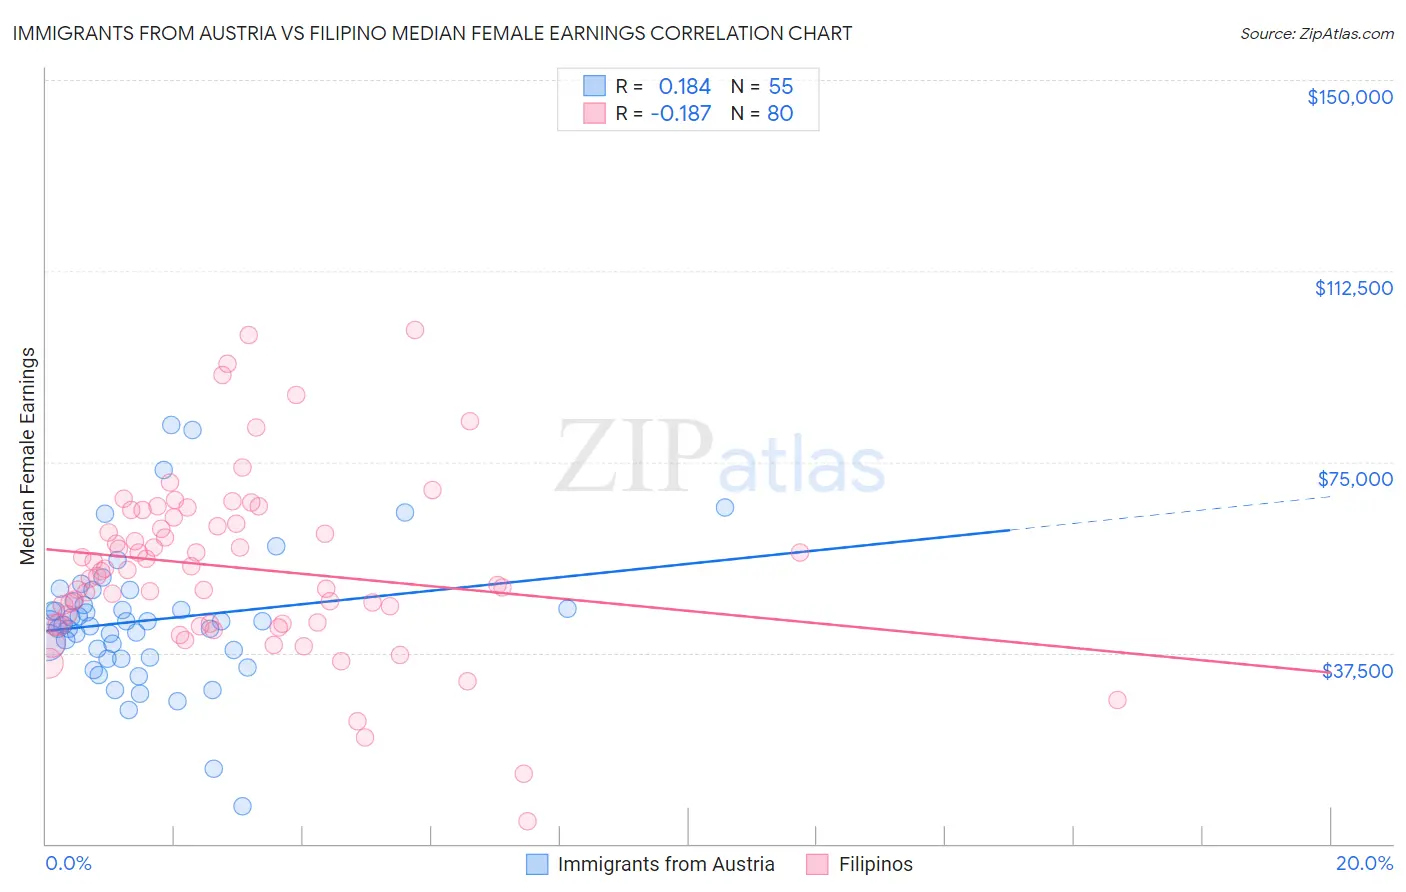
Immigrants from Austria vs Filipino Median Female Earnings Correlation Chart
The statistical analysis conducted on geographies consisting of 167,926,482 people shows a poor positive correlation between the proportion of Immigrants from Austria and median female earnings in the United States with a correlation coefficient (R) of 0.184 and weighted average of $42,824. Similarly, the statistical analysis conducted on geographies consisting of 254,323,298 people shows a poor negative correlation between the proportion of Filipinos and median female earnings in the United States with a correlation coefficient (R) of -0.187 and weighted average of $49,508, a difference of 15.6%.
Median Female Earnings Correlation Summary
| Measurement | Immigrants from Austria | Filipino |
| Minimum | $7,363 | $4,500 |
| Maximum | $82,240 | $100,821 |
| Range | $74,877 | $96,321 |
| Mean | $43,980 | $54,231 |
| Median | $43,611 | $53,668 |
| Interquartile 25% (IQ1) | $36,503 | $43,160 |
| Interquartile 75% (IQ3) | $47,678 | $63,449 |
| Interquartile Range (IQR) | $11,175 | $20,289 |
| Standard Deviation (Sample) | $13,481 | $17,351 |
| Standard Deviation (Population) | $13,358 | $17,242 |
Similar Demographics by Median Female Earnings
Demographics Similar to Immigrants from Austria by Median Female Earnings
In terms of median female earnings, the demographic groups most similar to Immigrants from Austria are Immigrants from Spain ($42,815, a difference of 0.020%), Immigrants from Norway ($42,837, a difference of 0.030%), Immigrants from Egypt ($42,837, a difference of 0.030%), Sierra Leonean ($42,868, a difference of 0.10%), and Immigrants from Ethiopia ($42,744, a difference of 0.19%).
| Demographics | Rating | Rank | Median Female Earnings |
| Immigrants | Bulgaria | 99.9 /100 | #61 | Exceptional $43,085 |
| Afghans | 99.9 /100 | #62 | Exceptional $43,077 |
| Immigrants | Ukraine | 99.9 /100 | #63 | Exceptional $43,069 |
| Immigrants | Pakistan | 99.9 /100 | #64 | Exceptional $43,052 |
| Sierra Leoneans | 99.9 /100 | #65 | Exceptional $42,868 |
| Immigrants | Norway | 99.9 /100 | #66 | Exceptional $42,837 |
| Immigrants | Egypt | 99.9 /100 | #67 | Exceptional $42,837 |
| Immigrants | Austria | 99.8 /100 | #68 | Exceptional $42,824 |
| Immigrants | Spain | 99.8 /100 | #69 | Exceptional $42,815 |
| Immigrants | Ethiopia | 99.8 /100 | #70 | Exceptional $42,744 |
| Immigrants | Romania | 99.8 /100 | #71 | Exceptional $42,718 |
| Albanians | 99.8 /100 | #72 | Exceptional $42,584 |
| Mongolians | 99.7 /100 | #73 | Exceptional $42,542 |
| Immigrants | South Africa | 99.7 /100 | #74 | Exceptional $42,508 |
| New Zealanders | 99.7 /100 | #75 | Exceptional $42,446 |
Demographics Similar to Filipinos by Median Female Earnings
In terms of median female earnings, the demographic groups most similar to Filipinos are Immigrants from Taiwan ($49,256, a difference of 0.51%), Immigrants from Hong Kong ($49,818, a difference of 0.63%), Immigrants from India ($48,292, a difference of 2.5%), Immigrants from Singapore ($47,986, a difference of 3.2%), and Immigrants from Ireland ($47,598, a difference of 4.0%).
| Demographics | Rating | Rank | Median Female Earnings |
| Immigrants | Hong Kong | 100.0 /100 | #1 | Exceptional $49,818 |
| Filipinos | 100.0 /100 | #2 | Exceptional $49,508 |
| Immigrants | Taiwan | 100.0 /100 | #3 | Exceptional $49,256 |
| Immigrants | India | 100.0 /100 | #4 | Exceptional $48,292 |
| Immigrants | Singapore | 100.0 /100 | #5 | Exceptional $47,986 |
| Immigrants | Ireland | 100.0 /100 | #6 | Exceptional $47,598 |
| Thais | 100.0 /100 | #7 | Exceptional $47,577 |
| Iranians | 100.0 /100 | #8 | Exceptional $47,421 |
| Immigrants | Iran | 100.0 /100 | #9 | Exceptional $47,154 |
| Immigrants | China | 100.0 /100 | #10 | Exceptional $46,972 |
| Okinawans | 100.0 /100 | #11 | Exceptional $46,905 |
| Immigrants | Israel | 100.0 /100 | #12 | Exceptional $46,902 |
| Immigrants | Australia | 100.0 /100 | #13 | Exceptional $46,573 |
| Soviet Union | 100.0 /100 | #14 | Exceptional $46,556 |
| Immigrants | Eastern Asia | 100.0 /100 | #15 | Exceptional $46,502 |