Immigrants from Austria vs Hungarian Median Female Earnings
COMPARE
Immigrants from Austria
Hungarian
Median Female Earnings
Median Female Earnings Comparison
Immigrants from Austria
Hungarians
$42,824
MEDIAN FEMALE EARNINGS
99.8/ 100
METRIC RATING
68th/ 347
METRIC RANK
$39,510
MEDIAN FEMALE EARNINGS
40.3/ 100
METRIC RATING
183rd/ 347
METRIC RANK
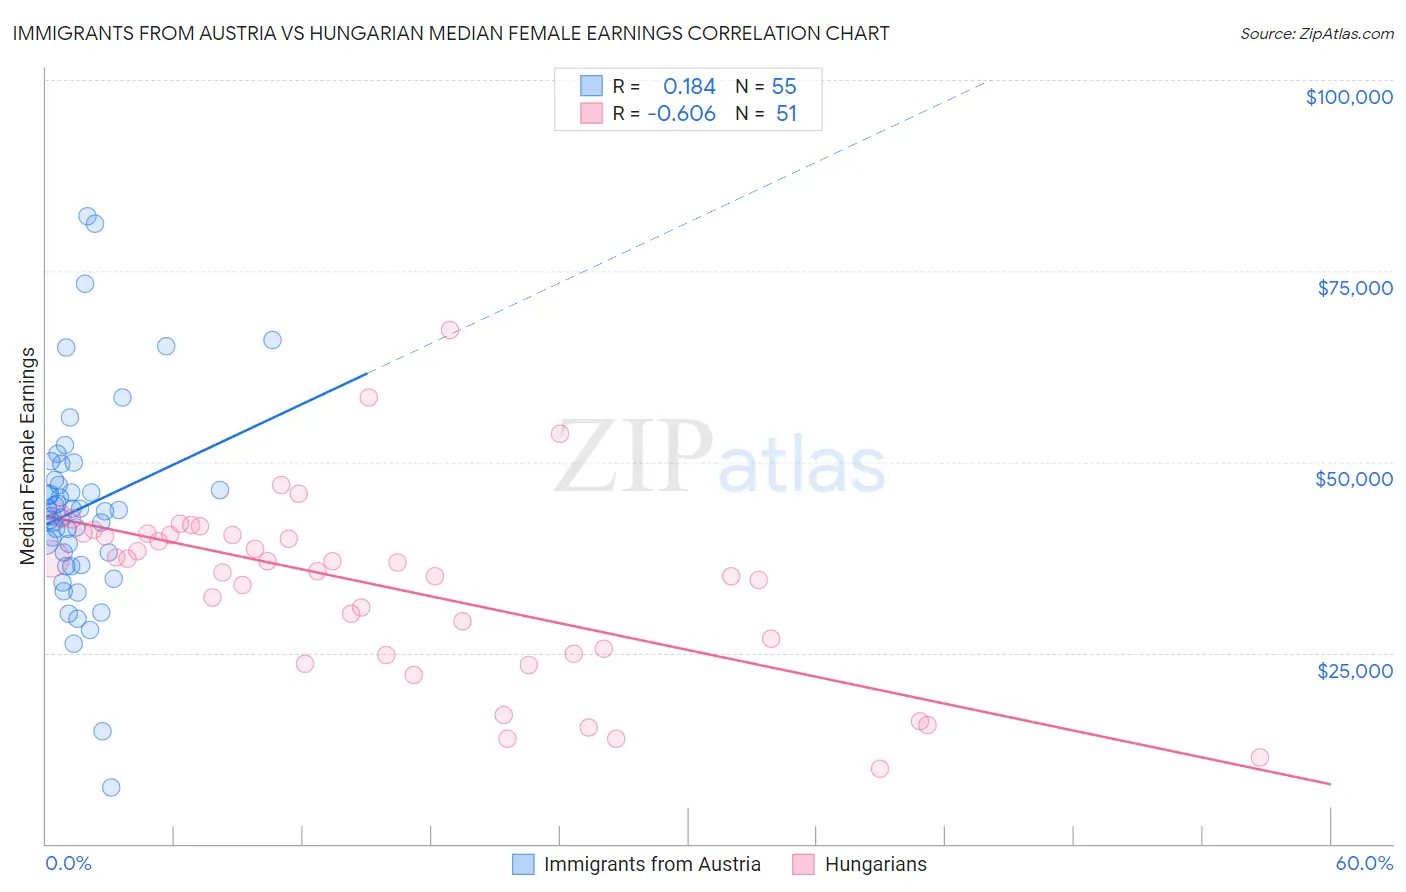
Immigrants from Austria vs Hungarian Median Female Earnings Correlation Chart
The statistical analysis conducted on geographies consisting of 167,926,482 people shows a poor positive correlation between the proportion of Immigrants from Austria and median female earnings in the United States with a correlation coefficient (R) of 0.184 and weighted average of $42,824. Similarly, the statistical analysis conducted on geographies consisting of 485,733,652 people shows a significant negative correlation between the proportion of Hungarians and median female earnings in the United States with a correlation coefficient (R) of -0.606 and weighted average of $39,510, a difference of 8.4%.
Median Female Earnings Correlation Summary
| Measurement | Immigrants from Austria | Hungarian |
| Minimum | $7,363 | $9,845 |
| Maximum | $82,240 | $67,329 |
| Range | $74,877 | $57,484 |
| Mean | $43,980 | $33,736 |
| Median | $43,611 | $36,875 |
| Interquartile 25% (IQ1) | $36,503 | $24,845 |
| Interquartile 75% (IQ3) | $47,678 | $40,519 |
| Interquartile Range (IQR) | $11,175 | $15,674 |
| Standard Deviation (Sample) | $13,481 | $11,915 |
| Standard Deviation (Population) | $13,358 | $11,798 |
Similar Demographics by Median Female Earnings
Demographics Similar to Immigrants from Austria by Median Female Earnings
In terms of median female earnings, the demographic groups most similar to Immigrants from Austria are Immigrants from Spain ($42,815, a difference of 0.020%), Immigrants from Norway ($42,837, a difference of 0.030%), Immigrants from Egypt ($42,837, a difference of 0.030%), Sierra Leonean ($42,868, a difference of 0.10%), and Immigrants from Ethiopia ($42,744, a difference of 0.19%).
| Demographics | Rating | Rank | Median Female Earnings |
| Immigrants | Bulgaria | 99.9 /100 | #61 | Exceptional $43,085 |
| Afghans | 99.9 /100 | #62 | Exceptional $43,077 |
| Immigrants | Ukraine | 99.9 /100 | #63 | Exceptional $43,069 |
| Immigrants | Pakistan | 99.9 /100 | #64 | Exceptional $43,052 |
| Sierra Leoneans | 99.9 /100 | #65 | Exceptional $42,868 |
| Immigrants | Norway | 99.9 /100 | #66 | Exceptional $42,837 |
| Immigrants | Egypt | 99.9 /100 | #67 | Exceptional $42,837 |
| Immigrants | Austria | 99.8 /100 | #68 | Exceptional $42,824 |
| Immigrants | Spain | 99.8 /100 | #69 | Exceptional $42,815 |
| Immigrants | Ethiopia | 99.8 /100 | #70 | Exceptional $42,744 |
| Immigrants | Romania | 99.8 /100 | #71 | Exceptional $42,718 |
| Albanians | 99.8 /100 | #72 | Exceptional $42,584 |
| Mongolians | 99.7 /100 | #73 | Exceptional $42,542 |
| Immigrants | South Africa | 99.7 /100 | #74 | Exceptional $42,508 |
| New Zealanders | 99.7 /100 | #75 | Exceptional $42,446 |
Demographics Similar to Hungarians by Median Female Earnings
In terms of median female earnings, the demographic groups most similar to Hungarians are Tlingit-Haida ($39,513, a difference of 0.010%), Tsimshian ($39,530, a difference of 0.050%), Immigrants from Kenya ($39,535, a difference of 0.060%), European ($39,457, a difference of 0.13%), and Immigrants from West Indies ($39,441, a difference of 0.18%).
| Demographics | Rating | Rank | Median Female Earnings |
| Nigerians | 47.0 /100 | #176 | Average $39,641 |
| Costa Ricans | 46.1 /100 | #177 | Average $39,622 |
| Slavs | 45.6 /100 | #178 | Average $39,613 |
| Immigrants | Germany | 45.1 /100 | #179 | Average $39,603 |
| Immigrants | Kenya | 41.6 /100 | #180 | Average $39,535 |
| Tsimshian | 41.4 /100 | #181 | Average $39,530 |
| Tlingit-Haida | 40.5 /100 | #182 | Average $39,513 |
| Hungarians | 40.3 /100 | #183 | Average $39,510 |
| Europeans | 37.7 /100 | #184 | Fair $39,457 |
| Immigrants | West Indies | 36.9 /100 | #185 | Fair $39,441 |
| Colombians | 36.9 /100 | #186 | Fair $39,439 |
| Swedes | 36.0 /100 | #187 | Fair $39,421 |
| Bermudans | 35.9 /100 | #188 | Fair $39,418 |
| Senegalese | 34.2 /100 | #189 | Fair $39,384 |
| Puget Sound Salish | 33.9 /100 | #190 | Fair $39,376 |