Armenian vs Filipino Median Female Earnings
COMPARE
Armenian
Filipino
Median Female Earnings
Median Female Earnings Comparison
Armenians
Filipinos
$42,212
MEDIAN FEMALE EARNINGS
99.5/ 100
METRIC RATING
84th/ 347
METRIC RANK
$49,508
MEDIAN FEMALE EARNINGS
100.0/ 100
METRIC RATING
2nd/ 347
METRIC RANK
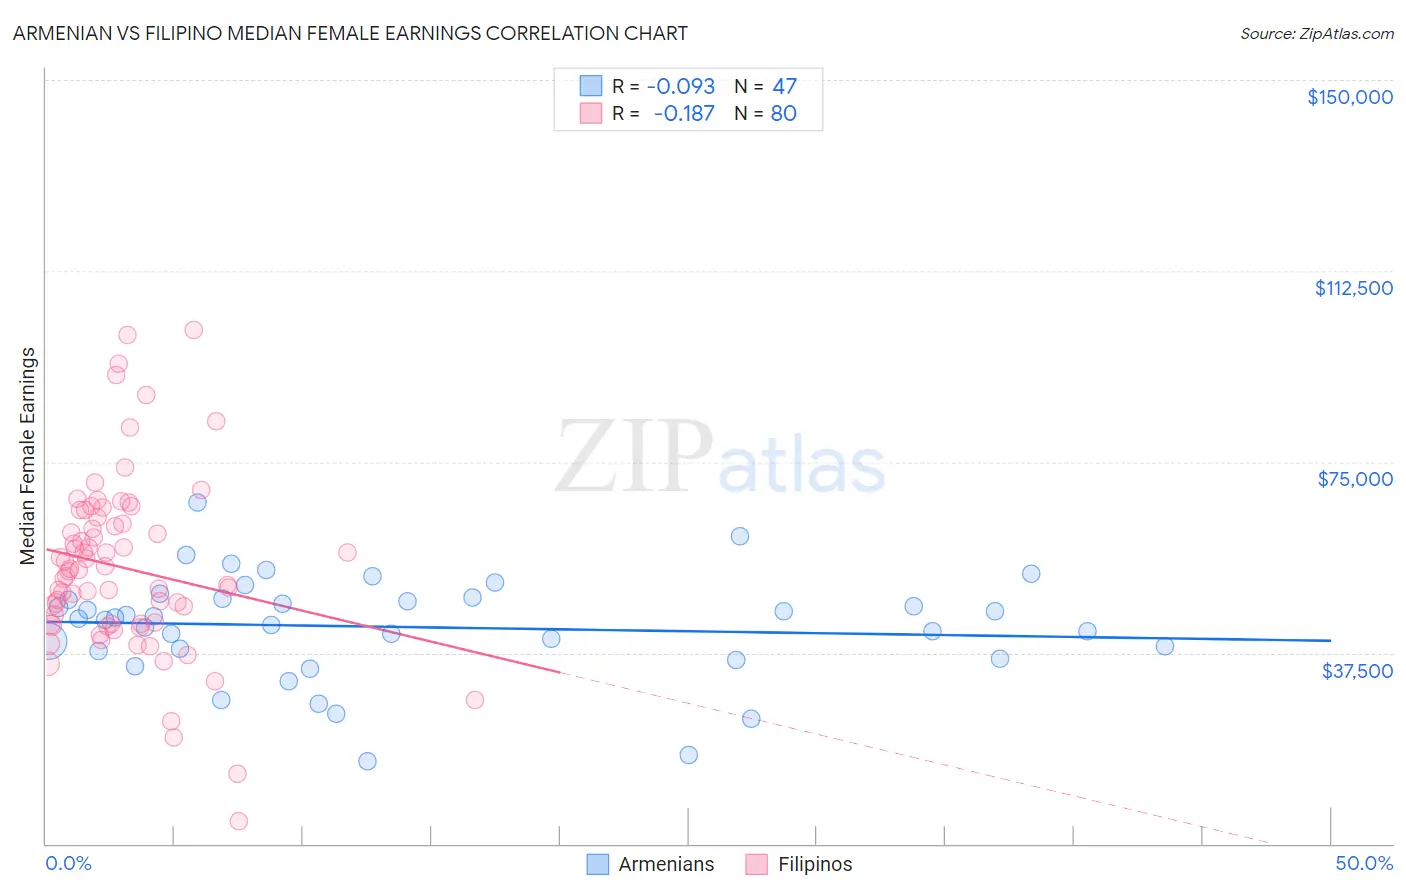
Armenian vs Filipino Median Female Earnings Correlation Chart
The statistical analysis conducted on geographies consisting of 310,826,336 people shows a slight negative correlation between the proportion of Armenians and median female earnings in the United States with a correlation coefficient (R) of -0.093 and weighted average of $42,212. Similarly, the statistical analysis conducted on geographies consisting of 254,323,298 people shows a poor negative correlation between the proportion of Filipinos and median female earnings in the United States with a correlation coefficient (R) of -0.187 and weighted average of $49,508, a difference of 17.3%.
Median Female Earnings Correlation Summary
| Measurement | Armenian | Filipino |
| Minimum | $16,250 | $4,500 |
| Maximum | $67,117 | $100,821 |
| Range | $50,867 | $96,321 |
| Mean | $42,561 | $54,231 |
| Median | $44,186 | $53,668 |
| Interquartile 25% (IQ1) | $37,899 | $43,160 |
| Interquartile 75% (IQ3) | $48,091 | $63,449 |
| Interquartile Range (IQR) | $10,192 | $20,289 |
| Standard Deviation (Sample) | $10,212 | $17,351 |
| Standard Deviation (Population) | $10,102 | $17,242 |
Similar Demographics by Median Female Earnings
Demographics Similar to Armenians by Median Female Earnings
In terms of median female earnings, the demographic groups most similar to Armenians are Immigrants from Sierra Leone ($42,214, a difference of 0.010%), Immigrants from Morocco ($42,229, a difference of 0.040%), Immigrants from Southern Europe ($42,275, a difference of 0.15%), Laotian ($42,133, a difference of 0.19%), and Immigrants from Moldova ($42,304, a difference of 0.22%).
| Demographics | Rating | Rank | Median Female Earnings |
| Immigrants | Albania | 99.6 /100 | #77 | Exceptional $42,388 |
| Immigrants | Kazakhstan | 99.6 /100 | #78 | Exceptional $42,386 |
| Greeks | 99.6 /100 | #79 | Exceptional $42,336 |
| Immigrants | Moldova | 99.6 /100 | #80 | Exceptional $42,304 |
| Immigrants | Southern Europe | 99.5 /100 | #81 | Exceptional $42,275 |
| Immigrants | Morocco | 99.5 /100 | #82 | Exceptional $42,229 |
| Immigrants | Sierra Leone | 99.5 /100 | #83 | Exceptional $42,214 |
| Armenians | 99.5 /100 | #84 | Exceptional $42,212 |
| Laotians | 99.4 /100 | #85 | Exceptional $42,133 |
| Immigrants | St. Vincent and the Grenadines | 99.3 /100 | #86 | Exceptional $42,108 |
| Lithuanians | 99.3 /100 | #87 | Exceptional $42,108 |
| Immigrants | Northern Africa | 99.3 /100 | #88 | Exceptional $42,084 |
| Immigrants | Afghanistan | 99.3 /100 | #89 | Exceptional $42,055 |
| Ukrainians | 99.2 /100 | #90 | Exceptional $42,015 |
| Immigrants | Western Europe | 99.2 /100 | #91 | Exceptional $41,990 |
Demographics Similar to Filipinos by Median Female Earnings
In terms of median female earnings, the demographic groups most similar to Filipinos are Immigrants from Taiwan ($49,256, a difference of 0.51%), Immigrants from Hong Kong ($49,818, a difference of 0.63%), Immigrants from India ($48,292, a difference of 2.5%), Immigrants from Singapore ($47,986, a difference of 3.2%), and Immigrants from Ireland ($47,598, a difference of 4.0%).
| Demographics | Rating | Rank | Median Female Earnings |
| Immigrants | Hong Kong | 100.0 /100 | #1 | Exceptional $49,818 |
| Filipinos | 100.0 /100 | #2 | Exceptional $49,508 |
| Immigrants | Taiwan | 100.0 /100 | #3 | Exceptional $49,256 |
| Immigrants | India | 100.0 /100 | #4 | Exceptional $48,292 |
| Immigrants | Singapore | 100.0 /100 | #5 | Exceptional $47,986 |
| Immigrants | Ireland | 100.0 /100 | #6 | Exceptional $47,598 |
| Thais | 100.0 /100 | #7 | Exceptional $47,577 |
| Iranians | 100.0 /100 | #8 | Exceptional $47,421 |
| Immigrants | Iran | 100.0 /100 | #9 | Exceptional $47,154 |
| Immigrants | China | 100.0 /100 | #10 | Exceptional $46,972 |
| Okinawans | 100.0 /100 | #11 | Exceptional $46,905 |
| Immigrants | Israel | 100.0 /100 | #12 | Exceptional $46,902 |
| Immigrants | Australia | 100.0 /100 | #13 | Exceptional $46,573 |
| Soviet Union | 100.0 /100 | #14 | Exceptional $46,556 |
| Immigrants | Eastern Asia | 100.0 /100 | #15 | Exceptional $46,502 |