Immigrants from Austria vs Filipino Family Poverty
COMPARE
Immigrants from Austria
Filipino
Family Poverty
Family Poverty Comparison
Immigrants from Austria
Filipinos
7.6%
FAMILY POVERTY
99.1/ 100
METRIC RATING
43rd/ 347
METRIC RANK
6.6%
FAMILY POVERTY
100.0/ 100
METRIC RATING
4th/ 347
METRIC RANK
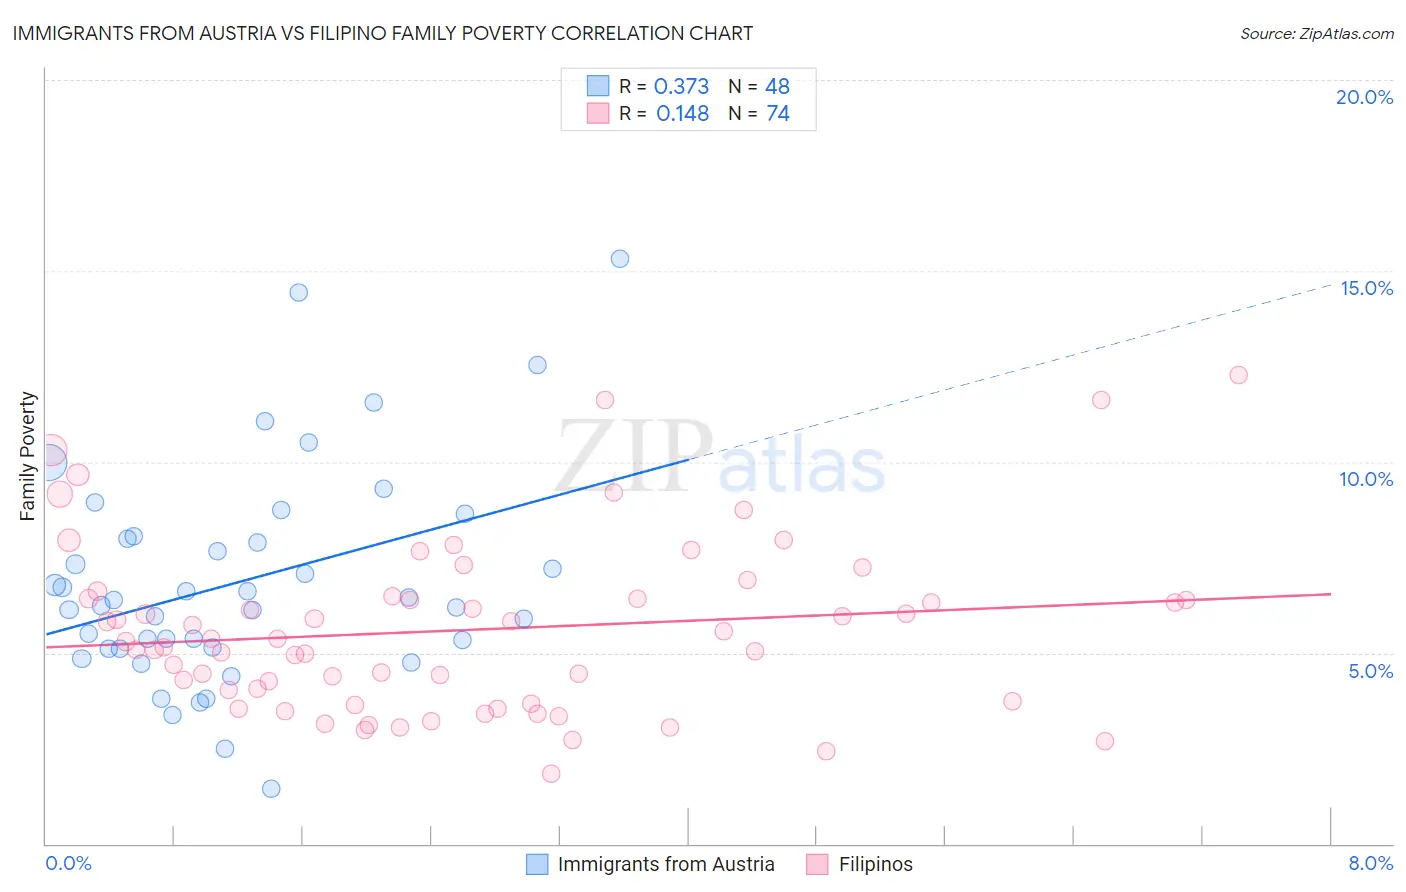
Immigrants from Austria vs Filipino Family Poverty Correlation Chart
The statistical analysis conducted on geographies consisting of 167,754,432 people shows a mild positive correlation between the proportion of Immigrants from Austria and poverty level among families in the United States with a correlation coefficient (R) of 0.373 and weighted average of 7.6%. Similarly, the statistical analysis conducted on geographies consisting of 253,803,740 people shows a poor positive correlation between the proportion of Filipinos and poverty level among families in the United States with a correlation coefficient (R) of 0.148 and weighted average of 6.6%, a difference of 14.8%.
Family Poverty Correlation Summary
| Measurement | Immigrants from Austria | Filipino |
| Minimum | 1.4% | 1.8% |
| Maximum | 15.3% | 12.3% |
| Range | 13.9% | 10.4% |
| Mean | 6.9% | 5.6% |
| Median | 6.3% | 5.3% |
| Interquartile 25% (IQ1) | 5.1% | 3.7% |
| Interquartile 75% (IQ3) | 8.0% | 6.4% |
| Interquartile Range (IQR) | 2.9% | 2.7% |
| Standard Deviation (Sample) | 2.8% | 2.2% |
| Standard Deviation (Population) | 2.8% | 2.2% |
Similar Demographics by Family Poverty
Demographics Similar to Immigrants from Austria by Family Poverty
In terms of family poverty, the demographic groups most similar to Immigrants from Austria are Scandinavian (7.6%, a difference of 0.24%), German (7.7%, a difference of 0.29%), Okinawan (7.7%, a difference of 0.41%), Tongan (7.7%, a difference of 0.43%), and Immigrants from Czechoslovakia (7.7%, a difference of 0.44%).
| Demographics | Rating | Rank | Family Poverty |
| Turks | 99.4 /100 | #36 | Exceptional 7.5% |
| Estonians | 99.4 /100 | #37 | Exceptional 7.5% |
| Bolivians | 99.3 /100 | #38 | Exceptional 7.5% |
| Carpatho Rusyns | 99.3 /100 | #39 | Exceptional 7.5% |
| Slovenes | 99.3 /100 | #40 | Exceptional 7.5% |
| Immigrants | Australia | 99.2 /100 | #41 | Exceptional 7.6% |
| Scandinavians | 99.1 /100 | #42 | Exceptional 7.6% |
| Immigrants | Austria | 99.1 /100 | #43 | Exceptional 7.6% |
| Germans | 99.0 /100 | #44 | Exceptional 7.7% |
| Okinawans | 98.9 /100 | #45 | Exceptional 7.7% |
| Tongans | 98.9 /100 | #46 | Exceptional 7.7% |
| Immigrants | Czechoslovakia | 98.9 /100 | #47 | Exceptional 7.7% |
| Immigrants | Sri Lanka | 98.9 /100 | #48 | Exceptional 7.7% |
| Immigrants | Bolivia | 98.9 /100 | #49 | Exceptional 7.7% |
| Immigrants | North Macedonia | 98.9 /100 | #50 | Exceptional 7.7% |
Demographics Similar to Filipinos by Family Poverty
In terms of family poverty, the demographic groups most similar to Filipinos are Thai (6.7%, a difference of 0.57%), Immigrants from Taiwan (6.6%, a difference of 0.61%), Chinese (6.5%, a difference of 2.2%), Norwegian (6.9%, a difference of 3.6%), and Immigrants from Ireland (7.0%, a difference of 5.0%).
| Demographics | Rating | Rank | Family Poverty |
| Immigrants | India | 100.0 /100 | #1 | Exceptional 6.2% |
| Chinese | 100.0 /100 | #2 | Exceptional 6.5% |
| Immigrants | Taiwan | 100.0 /100 | #3 | Exceptional 6.6% |
| Filipinos | 100.0 /100 | #4 | Exceptional 6.6% |
| Thais | 100.0 /100 | #5 | Exceptional 6.7% |
| Norwegians | 99.9 /100 | #6 | Exceptional 6.9% |
| Immigrants | Ireland | 99.9 /100 | #7 | Exceptional 7.0% |
| Bhutanese | 99.9 /100 | #8 | Exceptional 7.0% |
| Latvians | 99.9 /100 | #9 | Exceptional 7.1% |
| Bulgarians | 99.8 /100 | #10 | Exceptional 7.1% |
| Immigrants | Singapore | 99.8 /100 | #11 | Exceptional 7.1% |
| Maltese | 99.8 /100 | #12 | Exceptional 7.1% |
| Swedes | 99.8 /100 | #13 | Exceptional 7.1% |
| Iranians | 99.8 /100 | #14 | Exceptional 7.1% |
| Lithuanians | 99.8 /100 | #15 | Exceptional 7.2% |