Immigrants from Austria vs Spanish American Indian Median Female Earnings
COMPARE
Immigrants from Austria
Spanish American Indian
Median Female Earnings
Median Female Earnings Comparison
Immigrants from Austria
Spanish American Indians
$42,824
MEDIAN FEMALE EARNINGS
99.8/ 100
METRIC RATING
68th/ 347
METRIC RANK
$33,625
MEDIAN FEMALE EARNINGS
0.0/ 100
METRIC RATING
334th/ 347
METRIC RANK
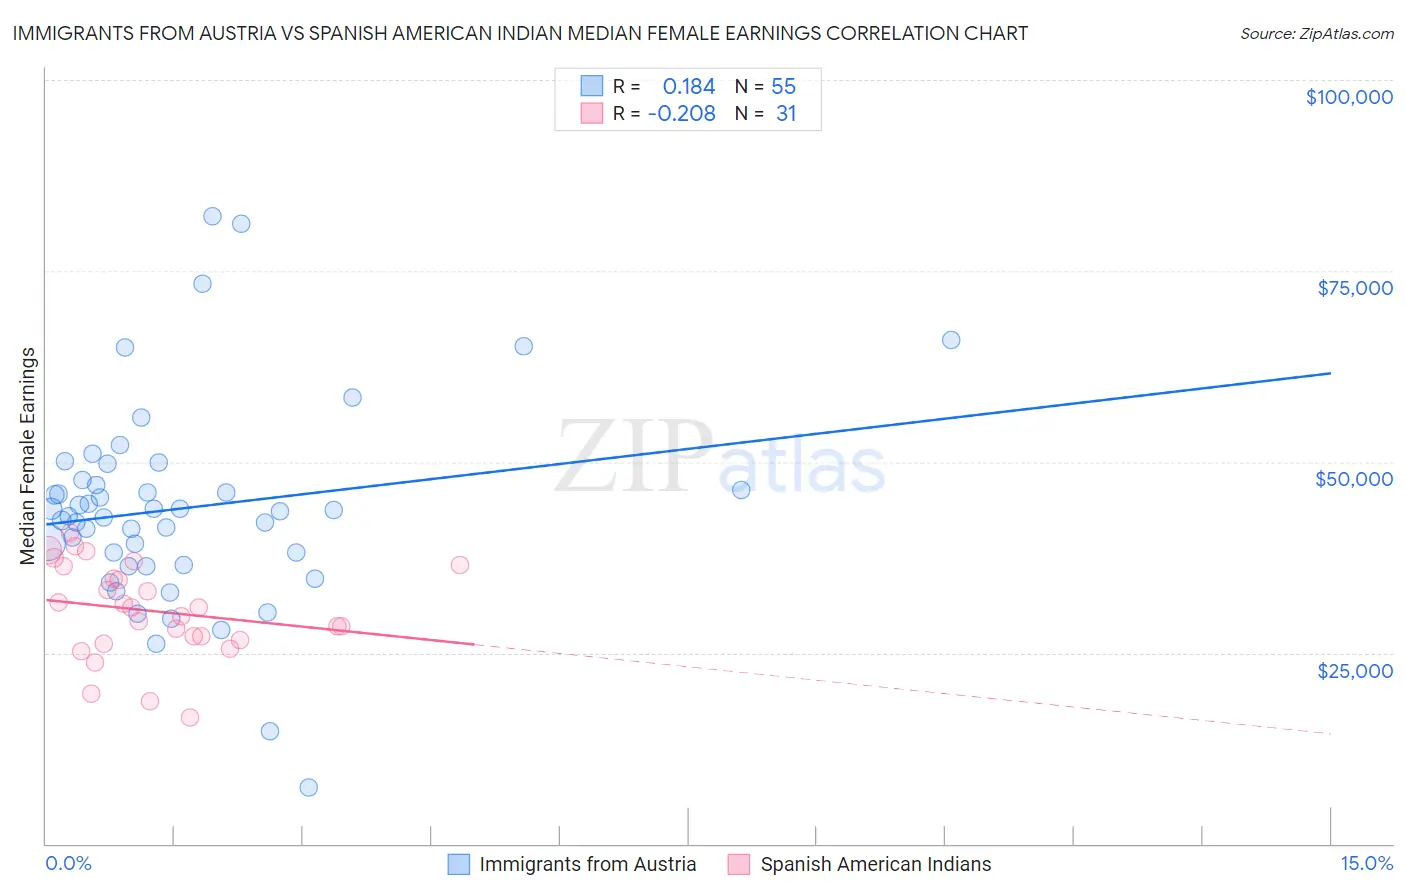
Immigrants from Austria vs Spanish American Indian Median Female Earnings Correlation Chart
The statistical analysis conducted on geographies consisting of 167,926,482 people shows a poor positive correlation between the proportion of Immigrants from Austria and median female earnings in the United States with a correlation coefficient (R) of 0.184 and weighted average of $42,824. Similarly, the statistical analysis conducted on geographies consisting of 73,144,962 people shows a weak negative correlation between the proportion of Spanish American Indians and median female earnings in the United States with a correlation coefficient (R) of -0.208 and weighted average of $33,625, a difference of 27.4%.
Median Female Earnings Correlation Summary
| Measurement | Immigrants from Austria | Spanish American Indian |
| Minimum | $7,363 | $16,510 |
| Maximum | $82,240 | $40,753 |
| Range | $74,877 | $24,243 |
| Mean | $43,980 | $30,468 |
| Median | $43,611 | $30,907 |
| Interquartile 25% (IQ1) | $36,503 | $26,648 |
| Interquartile 75% (IQ3) | $47,678 | $36,401 |
| Interquartile Range (IQR) | $11,175 | $9,753 |
| Standard Deviation (Sample) | $13,481 | $6,157 |
| Standard Deviation (Population) | $13,358 | $6,057 |
Similar Demographics by Median Female Earnings
Demographics Similar to Immigrants from Austria by Median Female Earnings
In terms of median female earnings, the demographic groups most similar to Immigrants from Austria are Immigrants from Spain ($42,815, a difference of 0.020%), Immigrants from Norway ($42,837, a difference of 0.030%), Immigrants from Egypt ($42,837, a difference of 0.030%), Sierra Leonean ($42,868, a difference of 0.10%), and Immigrants from Ethiopia ($42,744, a difference of 0.19%).
| Demographics | Rating | Rank | Median Female Earnings |
| Immigrants | Bulgaria | 99.9 /100 | #61 | Exceptional $43,085 |
| Afghans | 99.9 /100 | #62 | Exceptional $43,077 |
| Immigrants | Ukraine | 99.9 /100 | #63 | Exceptional $43,069 |
| Immigrants | Pakistan | 99.9 /100 | #64 | Exceptional $43,052 |
| Sierra Leoneans | 99.9 /100 | #65 | Exceptional $42,868 |
| Immigrants | Norway | 99.9 /100 | #66 | Exceptional $42,837 |
| Immigrants | Egypt | 99.9 /100 | #67 | Exceptional $42,837 |
| Immigrants | Austria | 99.8 /100 | #68 | Exceptional $42,824 |
| Immigrants | Spain | 99.8 /100 | #69 | Exceptional $42,815 |
| Immigrants | Ethiopia | 99.8 /100 | #70 | Exceptional $42,744 |
| Immigrants | Romania | 99.8 /100 | #71 | Exceptional $42,718 |
| Albanians | 99.8 /100 | #72 | Exceptional $42,584 |
| Mongolians | 99.7 /100 | #73 | Exceptional $42,542 |
| Immigrants | South Africa | 99.7 /100 | #74 | Exceptional $42,508 |
| New Zealanders | 99.7 /100 | #75 | Exceptional $42,446 |
Demographics Similar to Spanish American Indians by Median Female Earnings
In terms of median female earnings, the demographic groups most similar to Spanish American Indians are Mexican ($33,664, a difference of 0.12%), Choctaw ($33,775, a difference of 0.45%), Native/Alaskan ($33,806, a difference of 0.54%), Creek ($33,437, a difference of 0.56%), and Ottawa ($33,378, a difference of 0.74%).
| Demographics | Rating | Rank | Median Female Earnings |
| Cajuns | 0.0 /100 | #327 | Tragic $34,034 |
| Immigrants | Central America | 0.0 /100 | #328 | Tragic $33,953 |
| Hopi | 0.0 /100 | #329 | Tragic $33,932 |
| Menominee | 0.0 /100 | #330 | Tragic $33,894 |
| Natives/Alaskans | 0.0 /100 | #331 | Tragic $33,806 |
| Choctaw | 0.0 /100 | #332 | Tragic $33,775 |
| Mexicans | 0.0 /100 | #333 | Tragic $33,664 |
| Spanish American Indians | 0.0 /100 | #334 | Tragic $33,625 |
| Creek | 0.0 /100 | #335 | Tragic $33,437 |
| Ottawa | 0.0 /100 | #336 | Tragic $33,378 |
| Yakama | 0.0 /100 | #337 | Tragic $33,354 |
| Immigrants | Cuba | 0.0 /100 | #338 | Tragic $33,291 |
| Immigrants | Mexico | 0.0 /100 | #339 | Tragic $33,236 |
| Tohono O'odham | 0.0 /100 | #340 | Tragic $33,205 |
| Navajo | 0.0 /100 | #341 | Tragic $33,046 |