Immigrants from Haiti vs Filipino Median Female Earnings
COMPARE
Immigrants from Haiti
Filipino
Median Female Earnings
Median Female Earnings Comparison
Immigrants from Haiti
Filipinos
$36,203
MEDIAN FEMALE EARNINGS
0.1/ 100
METRIC RATING
283rd/ 347
METRIC RANK
$49,508
MEDIAN FEMALE EARNINGS
100.0/ 100
METRIC RATING
2nd/ 347
METRIC RANK
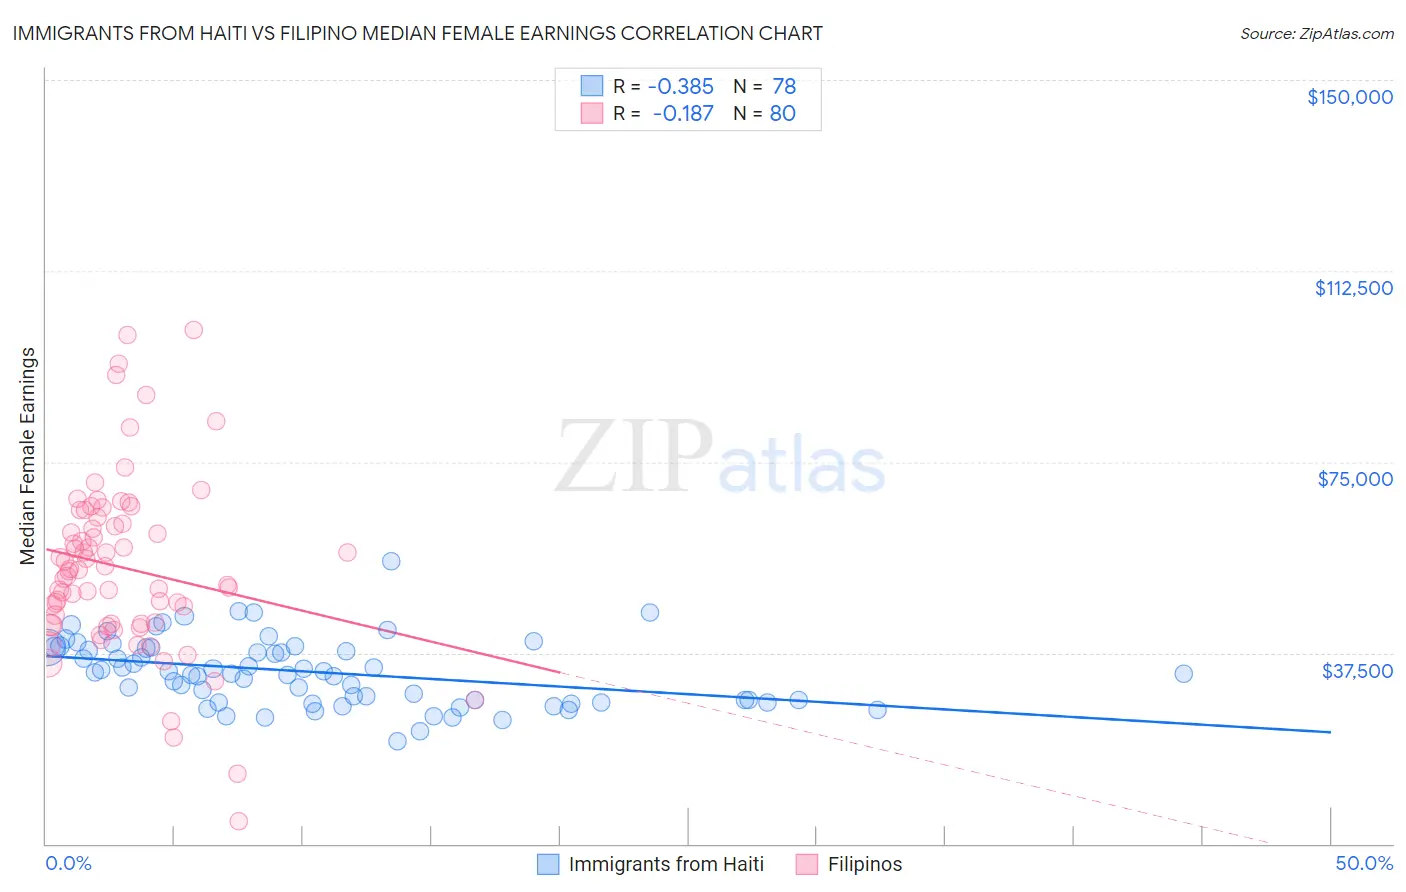
Immigrants from Haiti vs Filipino Median Female Earnings Correlation Chart
The statistical analysis conducted on geographies consisting of 225,248,114 people shows a mild negative correlation between the proportion of Immigrants from Haiti and median female earnings in the United States with a correlation coefficient (R) of -0.385 and weighted average of $36,203. Similarly, the statistical analysis conducted on geographies consisting of 254,323,298 people shows a poor negative correlation between the proportion of Filipinos and median female earnings in the United States with a correlation coefficient (R) of -0.187 and weighted average of $49,508, a difference of 36.7%.
Median Female Earnings Correlation Summary
| Measurement | Immigrants from Haiti | Filipino |
| Minimum | $20,229 | $4,500 |
| Maximum | $55,536 | $100,821 |
| Range | $35,307 | $96,321 |
| Mean | $33,736 | $54,231 |
| Median | $33,585 | $53,668 |
| Interquartile 25% (IQ1) | $28,139 | $43,160 |
| Interquartile 75% (IQ3) | $38,581 | $63,449 |
| Interquartile Range (IQR) | $10,442 | $20,289 |
| Standard Deviation (Sample) | $6,572 | $17,351 |
| Standard Deviation (Population) | $6,529 | $17,242 |
Similar Demographics by Median Female Earnings
Demographics Similar to Immigrants from Haiti by Median Female Earnings
In terms of median female earnings, the demographic groups most similar to Immigrants from Haiti are Indonesian ($36,140, a difference of 0.17%), Paiute ($36,056, a difference of 0.41%), Haitian ($36,374, a difference of 0.47%), Osage ($36,034, a difference of 0.47%), and Immigrants from Nicaragua ($36,023, a difference of 0.50%).
| Demographics | Rating | Rank | Median Female Earnings |
| Central Americans | 0.1 /100 | #276 | Tragic $36,492 |
| Marshallese | 0.1 /100 | #277 | Tragic $36,459 |
| U.S. Virgin Islanders | 0.1 /100 | #278 | Tragic $36,424 |
| Immigrants | Caribbean | 0.1 /100 | #279 | Tragic $36,414 |
| Iroquois | 0.1 /100 | #280 | Tragic $36,408 |
| Spanish Americans | 0.1 /100 | #281 | Tragic $36,391 |
| Haitians | 0.1 /100 | #282 | Tragic $36,374 |
| Immigrants | Haiti | 0.1 /100 | #283 | Tragic $36,203 |
| Indonesians | 0.1 /100 | #284 | Tragic $36,140 |
| Paiute | 0.1 /100 | #285 | Tragic $36,056 |
| Osage | 0.0 /100 | #286 | Tragic $36,034 |
| Immigrants | Nicaragua | 0.0 /100 | #287 | Tragic $36,023 |
| Immigrants | Zaire | 0.0 /100 | #288 | Tragic $36,017 |
| Bangladeshis | 0.0 /100 | #289 | Tragic $35,960 |
| Central American Indians | 0.0 /100 | #290 | Tragic $35,930 |
Demographics Similar to Filipinos by Median Female Earnings
In terms of median female earnings, the demographic groups most similar to Filipinos are Immigrants from Taiwan ($49,256, a difference of 0.51%), Immigrants from Hong Kong ($49,818, a difference of 0.63%), Immigrants from India ($48,292, a difference of 2.5%), Immigrants from Singapore ($47,986, a difference of 3.2%), and Immigrants from Ireland ($47,598, a difference of 4.0%).
| Demographics | Rating | Rank | Median Female Earnings |
| Immigrants | Hong Kong | 100.0 /100 | #1 | Exceptional $49,818 |
| Filipinos | 100.0 /100 | #2 | Exceptional $49,508 |
| Immigrants | Taiwan | 100.0 /100 | #3 | Exceptional $49,256 |
| Immigrants | India | 100.0 /100 | #4 | Exceptional $48,292 |
| Immigrants | Singapore | 100.0 /100 | #5 | Exceptional $47,986 |
| Immigrants | Ireland | 100.0 /100 | #6 | Exceptional $47,598 |
| Thais | 100.0 /100 | #7 | Exceptional $47,577 |
| Iranians | 100.0 /100 | #8 | Exceptional $47,421 |
| Immigrants | Iran | 100.0 /100 | #9 | Exceptional $47,154 |
| Immigrants | China | 100.0 /100 | #10 | Exceptional $46,972 |
| Okinawans | 100.0 /100 | #11 | Exceptional $46,905 |
| Immigrants | Israel | 100.0 /100 | #12 | Exceptional $46,902 |
| Immigrants | Australia | 100.0 /100 | #13 | Exceptional $46,573 |
| Soviet Union | 100.0 /100 | #14 | Exceptional $46,556 |
| Immigrants | Eastern Asia | 100.0 /100 | #15 | Exceptional $46,502 |