Immigrants from Austria vs Seminole Median Female Earnings
COMPARE
Immigrants from Austria
Seminole
Median Female Earnings
Median Female Earnings Comparison
Immigrants from Austria
Seminole
$42,824
MEDIAN FEMALE EARNINGS
99.8/ 100
METRIC RATING
68th/ 347
METRIC RANK
$34,385
MEDIAN FEMALE EARNINGS
0.0/ 100
METRIC RATING
323rd/ 347
METRIC RANK
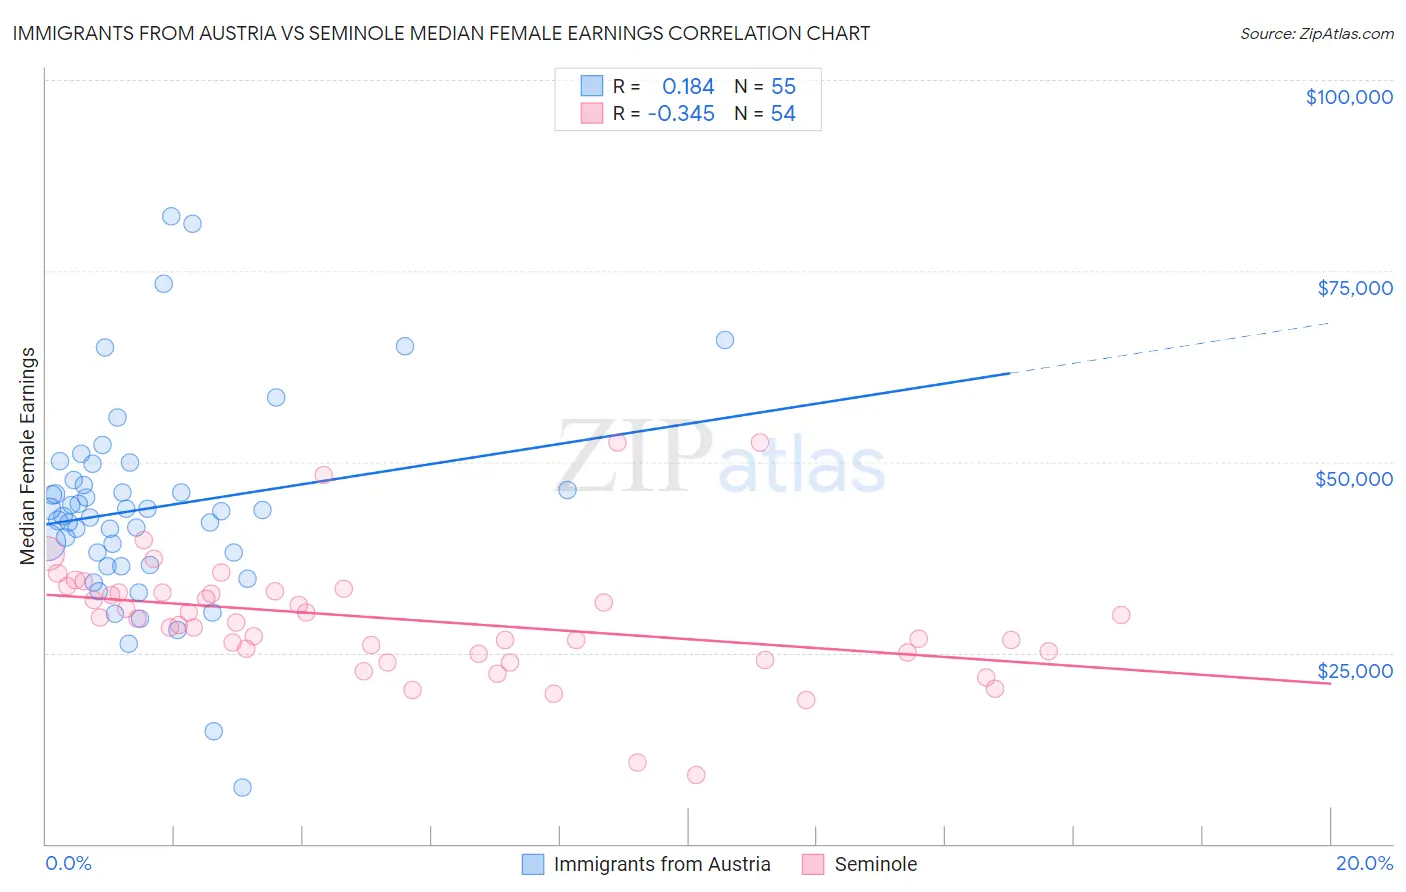
Immigrants from Austria vs Seminole Median Female Earnings Correlation Chart
The statistical analysis conducted on geographies consisting of 167,926,482 people shows a poor positive correlation between the proportion of Immigrants from Austria and median female earnings in the United States with a correlation coefficient (R) of 0.184 and weighted average of $42,824. Similarly, the statistical analysis conducted on geographies consisting of 118,266,998 people shows a mild negative correlation between the proportion of Seminole and median female earnings in the United States with a correlation coefficient (R) of -0.345 and weighted average of $34,385, a difference of 24.5%.
Median Female Earnings Correlation Summary
| Measurement | Immigrants from Austria | Seminole |
| Minimum | $7,363 | $9,041 |
| Maximum | $82,240 | $52,528 |
| Range | $74,877 | $43,487 |
| Mean | $43,980 | $29,347 |
| Median | $43,611 | $29,210 |
| Interquartile 25% (IQ1) | $36,503 | $25,000 |
| Interquartile 75% (IQ3) | $47,678 | $32,861 |
| Interquartile Range (IQR) | $11,175 | $7,861 |
| Standard Deviation (Sample) | $13,481 | $8,052 |
| Standard Deviation (Population) | $13,358 | $7,977 |
Similar Demographics by Median Female Earnings
Demographics Similar to Immigrants from Austria by Median Female Earnings
In terms of median female earnings, the demographic groups most similar to Immigrants from Austria are Immigrants from Spain ($42,815, a difference of 0.020%), Immigrants from Norway ($42,837, a difference of 0.030%), Immigrants from Egypt ($42,837, a difference of 0.030%), Sierra Leonean ($42,868, a difference of 0.10%), and Immigrants from Ethiopia ($42,744, a difference of 0.19%).
| Demographics | Rating | Rank | Median Female Earnings |
| Immigrants | Bulgaria | 99.9 /100 | #61 | Exceptional $43,085 |
| Afghans | 99.9 /100 | #62 | Exceptional $43,077 |
| Immigrants | Ukraine | 99.9 /100 | #63 | Exceptional $43,069 |
| Immigrants | Pakistan | 99.9 /100 | #64 | Exceptional $43,052 |
| Sierra Leoneans | 99.9 /100 | #65 | Exceptional $42,868 |
| Immigrants | Norway | 99.9 /100 | #66 | Exceptional $42,837 |
| Immigrants | Egypt | 99.9 /100 | #67 | Exceptional $42,837 |
| Immigrants | Austria | 99.8 /100 | #68 | Exceptional $42,824 |
| Immigrants | Spain | 99.8 /100 | #69 | Exceptional $42,815 |
| Immigrants | Ethiopia | 99.8 /100 | #70 | Exceptional $42,744 |
| Immigrants | Romania | 99.8 /100 | #71 | Exceptional $42,718 |
| Albanians | 99.8 /100 | #72 | Exceptional $42,584 |
| Mongolians | 99.7 /100 | #73 | Exceptional $42,542 |
| Immigrants | South Africa | 99.7 /100 | #74 | Exceptional $42,508 |
| New Zealanders | 99.7 /100 | #75 | Exceptional $42,446 |
Demographics Similar to Seminole by Median Female Earnings
In terms of median female earnings, the demographic groups most similar to Seminole are Chickasaw ($34,414, a difference of 0.080%), Hispanic or Latino ($34,421, a difference of 0.11%), Immigrants from Congo ($34,317, a difference of 0.20%), Immigrants from Honduras ($34,647, a difference of 0.76%), and Dutch West Indian ($34,106, a difference of 0.82%).
| Demographics | Rating | Rank | Median Female Earnings |
| Cherokee | 0.0 /100 | #316 | Tragic $34,742 |
| Potawatomi | 0.0 /100 | #317 | Tragic $34,739 |
| Immigrants | Yemen | 0.0 /100 | #318 | Tragic $34,693 |
| Shoshone | 0.0 /100 | #319 | Tragic $34,677 |
| Immigrants | Honduras | 0.0 /100 | #320 | Tragic $34,647 |
| Hispanics or Latinos | 0.0 /100 | #321 | Tragic $34,421 |
| Chickasaw | 0.0 /100 | #322 | Tragic $34,414 |
| Seminole | 0.0 /100 | #323 | Tragic $34,385 |
| Immigrants | Congo | 0.0 /100 | #324 | Tragic $34,317 |
| Dutch West Indians | 0.0 /100 | #325 | Tragic $34,106 |
| Kiowa | 0.0 /100 | #326 | Tragic $34,074 |
| Cajuns | 0.0 /100 | #327 | Tragic $34,034 |
| Immigrants | Central America | 0.0 /100 | #328 | Tragic $33,953 |
| Hopi | 0.0 /100 | #329 | Tragic $33,932 |
| Menominee | 0.0 /100 | #330 | Tragic $33,894 |