Immigrants from Australia vs Cape Verdean Median Earnings
COMPARE
Immigrants from Australia
Cape Verdean
Median Earnings
Median Earnings Comparison
Immigrants from Australia
Cape Verdeans
$56,305
MEDIAN EARNINGS
100.0/ 100
METRIC RATING
14th/ 347
METRIC RANK
$44,640
MEDIAN EARNINGS
7.5/ 100
METRIC RATING
234th/ 347
METRIC RANK
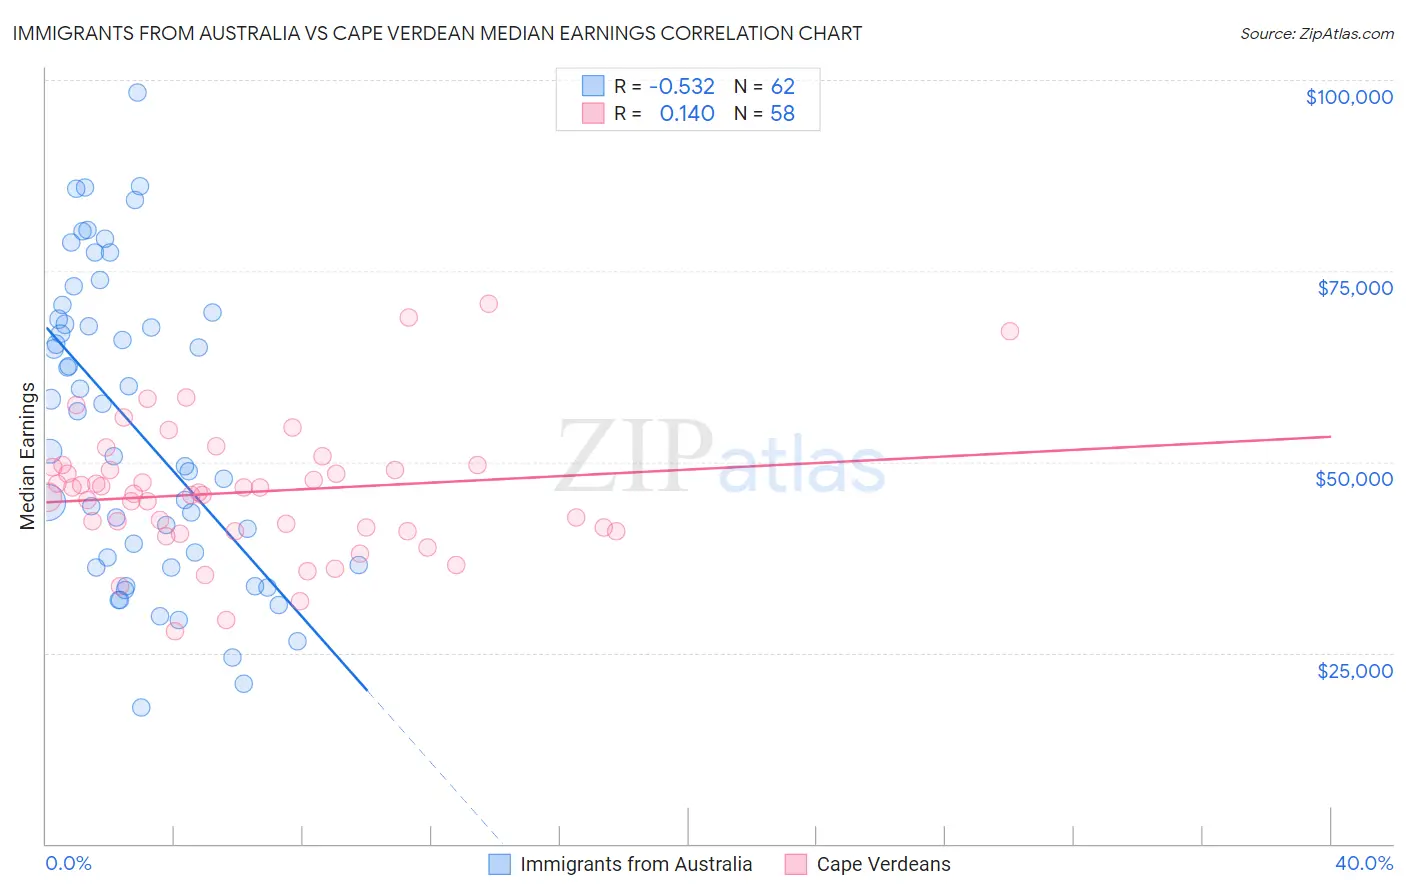
Immigrants from Australia vs Cape Verdean Median Earnings Correlation Chart
The statistical analysis conducted on geographies consisting of 227,197,451 people shows a substantial negative correlation between the proportion of Immigrants from Australia and median earnings in the United States with a correlation coefficient (R) of -0.532 and weighted average of $56,305. Similarly, the statistical analysis conducted on geographies consisting of 107,579,856 people shows a poor positive correlation between the proportion of Cape Verdeans and median earnings in the United States with a correlation coefficient (R) of 0.140 and weighted average of $44,640, a difference of 26.1%.
Median Earnings Correlation Summary
| Measurement | Immigrants from Australia | Cape Verdean |
| Minimum | $17,795 | $27,841 |
| Maximum | $98,400 | $70,758 |
| Range | $80,605 | $42,917 |
| Mean | $54,359 | $46,038 |
| Median | $54,001 | $45,876 |
| Interquartile 25% (IQ1) | $36,563 | $40,962 |
| Interquartile 75% (IQ3) | $68,667 | $49,336 |
| Interquartile Range (IQR) | $32,104 | $8,374 |
| Standard Deviation (Sample) | $19,682 | $8,551 |
| Standard Deviation (Population) | $19,523 | $8,477 |
Similar Demographics by Median Earnings
Demographics Similar to Immigrants from Australia by Median Earnings
In terms of median earnings, the demographic groups most similar to Immigrants from Australia are Indian (Asian) ($56,253, a difference of 0.090%), Immigrants from Eastern Asia ($56,183, a difference of 0.22%), Immigrants from China ($56,638, a difference of 0.59%), Immigrants from Ireland ($56,854, a difference of 0.97%), and Immigrants from Israel ($57,034, a difference of 1.3%).
| Demographics | Rating | Rank | Median Earnings |
| Iranians | 100.0 /100 | #7 | Exceptional $58,474 |
| Immigrants | Iran | 100.0 /100 | #8 | Exceptional $57,612 |
| Okinawans | 100.0 /100 | #9 | Exceptional $57,550 |
| Immigrants | South Central Asia | 100.0 /100 | #10 | Exceptional $57,114 |
| Immigrants | Israel | 100.0 /100 | #11 | Exceptional $57,034 |
| Immigrants | Ireland | 100.0 /100 | #12 | Exceptional $56,854 |
| Immigrants | China | 100.0 /100 | #13 | Exceptional $56,638 |
| Immigrants | Australia | 100.0 /100 | #14 | Exceptional $56,305 |
| Indians (Asian) | 100.0 /100 | #15 | Exceptional $56,253 |
| Immigrants | Eastern Asia | 100.0 /100 | #16 | Exceptional $56,183 |
| Eastern Europeans | 100.0 /100 | #17 | Exceptional $55,084 |
| Immigrants | Japan | 100.0 /100 | #18 | Exceptional $54,938 |
| Immigrants | Belgium | 100.0 /100 | #19 | Exceptional $54,679 |
| Cypriots | 100.0 /100 | #20 | Exceptional $54,589 |
| Burmese | 100.0 /100 | #21 | Exceptional $54,559 |
Demographics Similar to Cape Verdeans by Median Earnings
In terms of median earnings, the demographic groups most similar to Cape Verdeans are Venezuelan ($44,580, a difference of 0.14%), British West Indian ($44,552, a difference of 0.20%), Immigrants from Sudan ($44,767, a difference of 0.28%), Delaware ($44,783, a difference of 0.32%), and Immigrants from Ecuador ($44,462, a difference of 0.40%).
| Demographics | Rating | Rank | Median Earnings |
| Native Hawaiians | 12.2 /100 | #227 | Poor $45,027 |
| Immigrants | Iraq | 11.6 /100 | #228 | Poor $44,988 |
| Scotch-Irish | 10.7 /100 | #229 | Poor $44,924 |
| Immigrants | Western Africa | 10.3 /100 | #230 | Poor $44,893 |
| Japanese | 9.5 /100 | #231 | Tragic $44,825 |
| Delaware | 9.0 /100 | #232 | Tragic $44,783 |
| Immigrants | Sudan | 8.8 /100 | #233 | Tragic $44,767 |
| Cape Verdeans | 7.5 /100 | #234 | Tragic $44,640 |
| Venezuelans | 6.9 /100 | #235 | Tragic $44,580 |
| British West Indians | 6.7 /100 | #236 | Tragic $44,552 |
| Immigrants | Ecuador | 5.9 /100 | #237 | Tragic $44,462 |
| Sudanese | 5.6 /100 | #238 | Tragic $44,419 |
| Senegalese | 5.3 /100 | #239 | Tragic $44,373 |
| Aleuts | 4.4 /100 | #240 | Tragic $44,241 |
| Samoans | 4.2 /100 | #241 | Tragic $44,206 |