Immigrants from Asia vs Sioux Wage/Income Gap
COMPARE
Immigrants from Asia
Sioux
Wage/Income Gap
Wage/Income Gap Comparison
Immigrants from Asia
Sioux
27.0%
WAGE/INCOME GAP
5.5/ 100
METRIC RATING
229th/ 347
METRIC RANK
24.3%
WAGE/INCOME GAP
96.9/ 100
METRIC RATING
113th/ 347
METRIC RANK
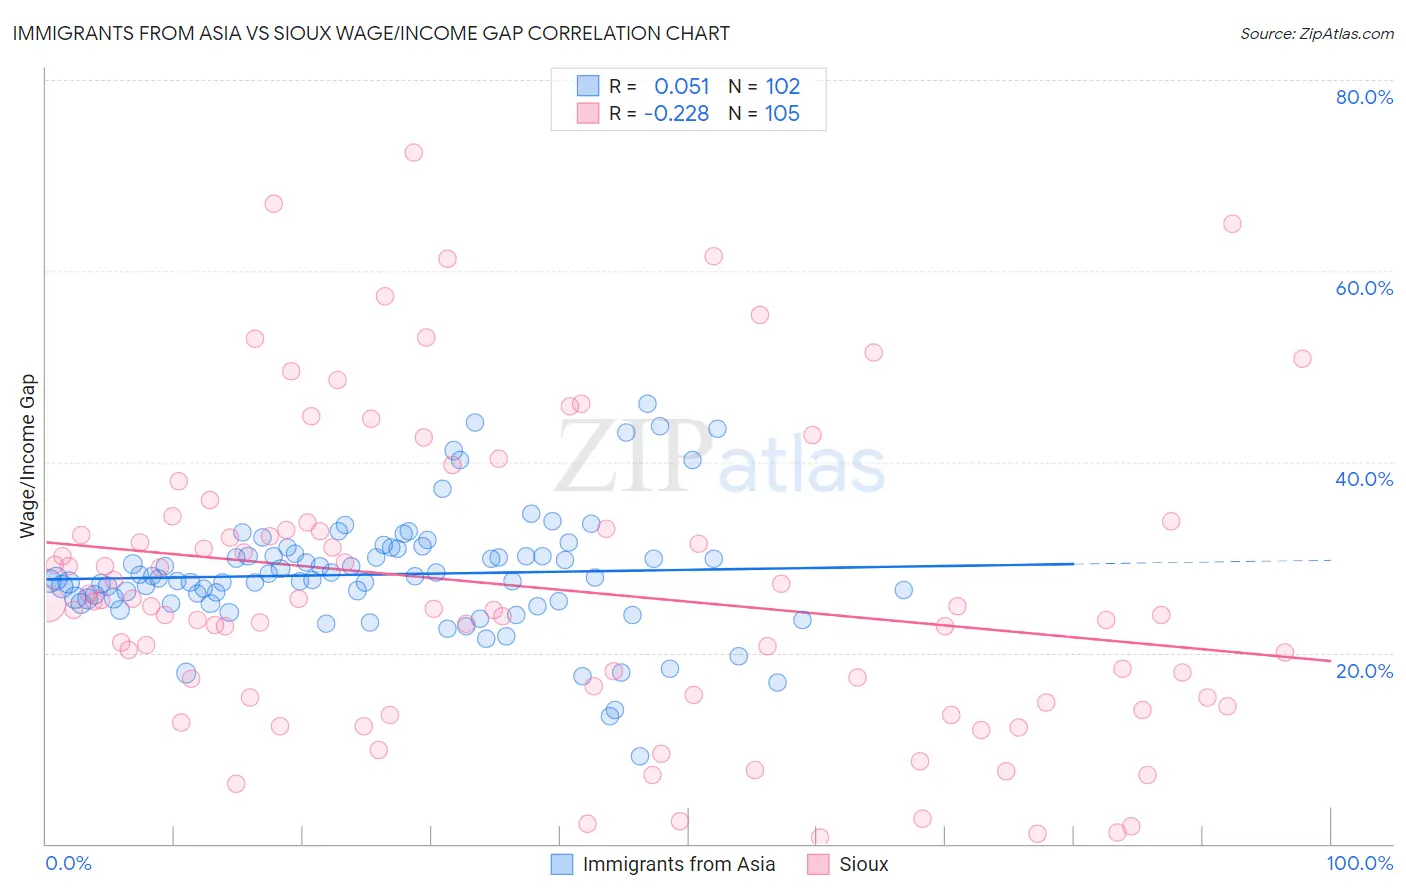
Immigrants from Asia vs Sioux Wage/Income Gap Correlation Chart
The statistical analysis conducted on geographies consisting of 547,716,290 people shows a slight positive correlation between the proportion of Immigrants from Asia and wage/income gap percentage in the United States with a correlation coefficient (R) of 0.051 and weighted average of 27.0%. Similarly, the statistical analysis conducted on geographies consisting of 233,992,822 people shows a weak negative correlation between the proportion of Sioux and wage/income gap percentage in the United States with a correlation coefficient (R) of -0.228 and weighted average of 24.3%, a difference of 10.9%.
Wage/Income Gap Correlation Summary
| Measurement | Immigrants from Asia | Sioux |
| Minimum | 9.2% | 0.72% |
| Maximum | 46.1% | 72.4% |
| Range | 36.9% | 71.7% |
| Mean | 28.2% | 26.9% |
| Median | 27.8% | 24.9% |
| Interquartile 25% (IQ1) | 25.4% | 15.3% |
| Interquartile 75% (IQ3) | 30.4% | 33.4% |
| Interquartile Range (IQR) | 4.9% | 18.1% |
| Standard Deviation (Sample) | 6.3% | 15.9% |
| Standard Deviation (Population) | 6.2% | 15.8% |
Similar Demographics by Wage/Income Gap
Demographics Similar to Immigrants from Asia by Wage/Income Gap
In terms of wage/income gap, the demographic groups most similar to Immigrants from Asia are Immigrants from Turkey (27.0%, a difference of 0.030%), Spaniard (27.0%, a difference of 0.040%), Ottawa (27.0%, a difference of 0.050%), Bhutanese (27.0%, a difference of 0.070%), and Argentinean (27.0%, a difference of 0.10%).
| Demographics | Rating | Rank | Wage/Income Gap |
| Bolivians | 8.3 /100 | #222 | Tragic 26.8% |
| Jordanians | 8.0 /100 | #223 | Tragic 26.8% |
| Immigrants | Argentina | 7.2 /100 | #224 | Tragic 26.8% |
| Immigrants | Ireland | 6.5 /100 | #225 | Tragic 26.9% |
| Asians | 5.9 /100 | #226 | Tragic 26.9% |
| Spaniards | 5.6 /100 | #227 | Tragic 27.0% |
| Immigrants | Turkey | 5.6 /100 | #228 | Tragic 27.0% |
| Immigrants | Asia | 5.5 /100 | #229 | Tragic 27.0% |
| Ottawa | 5.3 /100 | #230 | Tragic 27.0% |
| Bhutanese | 5.3 /100 | #231 | Tragic 27.0% |
| Argentineans | 5.2 /100 | #232 | Tragic 27.0% |
| Immigrants | Brazil | 5.0 /100 | #233 | Tragic 27.0% |
| Immigrants | Pakistan | 4.9 /100 | #234 | Tragic 27.0% |
| Immigrants | Hungary | 4.8 /100 | #235 | Tragic 27.0% |
| Immigrants | Romania | 4.8 /100 | #236 | Tragic 27.0% |
Demographics Similar to Sioux by Wage/Income Gap
In terms of wage/income gap, the demographic groups most similar to Sioux are Immigrants from Colombia (24.3%, a difference of 0.050%), Panamanian (24.4%, a difference of 0.20%), Immigrants from Kenya (24.4%, a difference of 0.26%), Alaska Native (24.4%, a difference of 0.43%), and Soviet Union (24.2%, a difference of 0.45%).
| Demographics | Rating | Rank | Wage/Income Gap |
| Sudanese | 98.6 /100 | #106 | Exceptional 24.0% |
| Yaqui | 98.4 /100 | #107 | Exceptional 24.0% |
| Immigrants | Albania | 98.4 /100 | #108 | Exceptional 24.0% |
| Ugandans | 98.3 /100 | #109 | Exceptional 24.1% |
| Immigrants | Morocco | 98.1 /100 | #110 | Exceptional 24.1% |
| Soviet Union | 97.6 /100 | #111 | Exceptional 24.2% |
| Immigrants | Colombia | 97.0 /100 | #112 | Exceptional 24.3% |
| Sioux | 96.9 /100 | #113 | Exceptional 24.3% |
| Panamanians | 96.5 /100 | #114 | Exceptional 24.4% |
| Immigrants | Kenya | 96.4 /100 | #115 | Exceptional 24.4% |
| Alaska Natives | 96.0 /100 | #116 | Exceptional 24.4% |
| Immigrants | Afghanistan | 95.9 /100 | #117 | Exceptional 24.4% |
| Immigrants | Micronesia | 95.8 /100 | #118 | Exceptional 24.4% |
| Kenyans | 95.8 /100 | #119 | Exceptional 24.5% |
| Cree | 95.6 /100 | #120 | Exceptional 24.5% |