Immigrants from Albania vs Immigrants from Norway Householder Income Ages 45 - 64 years

COMPARE

Immigrants from Albania
Race
Ancestry
AfghanAfricanAlaska NativeAlaskan AthabascanAlbanianAleutAlsatianAmericanApacheArabArapahoArgentineanArmenianAssyrian/Chaldean/SyriacAustralianAustrianBahamianBangladeshiBarbadianBasqueBelgianBelizeanBermudanBhutaneseBlackfeetBolivianBrazilianBritishBritish West IndianBulgarianBurmeseCajunCambodianCanadianCape VerdeanCarpatho RusynCelticCentral AmericanCentral American IndianCherokeeCheyenneChickasawChileanChineseChippewaChoctawColombianColvilleComancheCosta RicanCreeCreekCroatianCrowCubanCypriotCzechCzechoslovakianDanishDelawareDominicanDutchDutch West IndianEastern EuropeanEcuadorianEgyptianEnglishEstonianEthiopianEuropeanFijianFilipinoFinnishFrenchFrench American IndianFrench CanadianGermanGerman RussianGhanaianGreekGuamanian/ChamorroGuatemalanGuyaneseHaitianHmongHonduranHopiHoumaHungarianIcelanderIndian (Asian)IndonesianInupiatIranianIraqiIrishIroquoisIsraeliItalianJamaicanJapaneseJordanianKenyanKiowaKoreanLaotianLatvianLebaneseLiberianLithuanianLumbeeLuxembourgerMacedonianMalaysianMalteseMarshalleseMenomineeMexicanMexican American IndianMongolianMoroccanNative HawaiianNavajoNepaleseNew ZealanderNicaraguanNigerianNorthern EuropeanNorwegianOkinawanOsageOttawaPaiutePakistaniPalestinianPanamanianParaguayanPennsylvania GermanPeruvianPimaPolishPortuguesePotawatomiPuebloPuerto RicanPuget Sound SalishRomanianRussianSalvadoranSamoanScandinavianScotch-IrishScottishSeminoleSenegaleseSerbianShoshoneSierra LeoneanSiouxSlavicSlovakSloveneSomaliSouth AfricanSouth AmericanSouth American IndianSoviet UnionSpaniardSpanishSpanish AmericanSpanish American IndianSri LankanSubsaharan AfricanSudaneseSwedishSwissSyrianTaiwaneseThaiTlingit-HaidaTohono O'OdhamTonganTrinidadian and TobagonianTsimshianTurkishU.S. Virgin IslanderUgandanUkrainianUruguayanUteVenezuelanVietnameseWelshWest IndianYakamaYaquiYugoslavianYumanYup'ikZimbabwean
Immigration
NonimmigrantsImmigrantsAfghanistanAfricaAlbaniaArgentinaArmeniaAsiaAustraliaAustriaBahamasBangladeshBarbadosBelarusBelgiumBelizeBoliviaBosnia and HerzegovinaBrazilBulgariaBurma/MyanmarCabo VerdeCambodiaCameroonCanadaCaribbeanCentral AmericaChileChinaColombiaCongoCosta RicaCroatiaCubaCzechoslovakiaDenmarkDominicaDominican RepublicEastern AfricaEastern AsiaEastern EuropeEcuadorEgyptEl SalvadorEnglandEritreaEthiopiaEuropeFijiFranceGermanyGhanaGreeceGrenadaGuatemalaGuyanaHaitiHondurasHong KongHungaryIndiaIndonesiaIranIraqIrelandIsraelItalyJamaicaJapanJordanKazakhstanKenyaKoreaKuwaitLaosLatin AmericaLatviaLebanonLiberiaLithuaniaMalaysiaMexicoMicronesiaMiddle AfricaMoldovaMoroccoNepalNetherlandsNicaraguaNigeriaNorth AmericaNorth MacedoniaNorthern AfricaNorthern EuropeOceaniaPakistanPanamaPeruPhilippinesPolandPortugalRomaniaRussiaSaudi ArabiaScotlandSenegalSerbiaSierra LeoneSingaporeSomaliaSouth AfricaSouth AmericaSouth Central AsiaSouth Eastern AsiaSouthern EuropeSpainSri LankaSt. Vincent and the GrenadinesSudanSwedenSwitzerlandSyriaTaiwanThailandTrinidad and TobagoTurkeyUgandaUkraineUruguayUzbekistanVenezuelaVietnamWest IndiesWestern AfricaWestern AsiaWestern EuropeYemenZaireZimbabweAzores
Immigrants from Norway
Race
Ancestry
AfghanAfricanAlaska NativeAlaskan AthabascanAlbanianAleutAlsatianAmericanApacheArabArapahoArgentineanArmenianAssyrian/Chaldean/SyriacAustralianAustrianBahamianBangladeshiBarbadianBasqueBelgianBelizeanBermudanBhutaneseBlackfeetBolivianBrazilianBritishBritish West IndianBulgarianBurmeseCajunCambodianCanadianCape VerdeanCarpatho RusynCelticCentral AmericanCentral American IndianCherokeeCheyenneChickasawChileanChineseChippewaChoctawColombianColvilleComancheCosta RicanCreeCreekCroatianCrowCubanCypriotCzechCzechoslovakianDanishDelawareDominicanDutchDutch West IndianEastern EuropeanEcuadorianEgyptianEnglishEstonianEthiopianEuropeanFijianFilipinoFinnishFrenchFrench American IndianFrench CanadianGermanGerman RussianGhanaianGreekGuamanian/ChamorroGuatemalanGuyaneseHaitianHmongHonduranHopiHoumaHungarianIcelanderIndian (Asian)IndonesianInupiatIranianIraqiIrishIroquoisIsraeliItalianJamaicanJapaneseJordanianKenyanKiowaKoreanLaotianLatvianLebaneseLiberianLithuanianLumbeeLuxembourgerMacedonianMalaysianMalteseMarshalleseMenomineeMexicanMexican American IndianMongolianMoroccanNative HawaiianNavajoNepaleseNew ZealanderNicaraguanNigerianNorthern EuropeanNorwegianOkinawanOsageOttawaPaiutePakistaniPalestinianPanamanianParaguayanPennsylvania GermanPeruvianPimaPolishPortuguesePotawatomiPuebloPuerto RicanPuget Sound SalishRomanianRussianSalvadoranSamoanScandinavianScotch-IrishScottishSeminoleSenegaleseSerbianShoshoneSierra LeoneanSiouxSlavicSlovakSloveneSomaliSouth AfricanSouth AmericanSouth American IndianSoviet UnionSpaniardSpanishSpanish AmericanSpanish American IndianSri LankanSubsaharan AfricanSudaneseSwedishSwissSyrianTaiwaneseThaiTlingit-HaidaTohono O'OdhamTonganTrinidadian and TobagonianTsimshianTurkishU.S. Virgin IslanderUgandanUkrainianUruguayanUteVenezuelanVietnameseWelshWest IndianYakamaYaquiYugoslavianYumanYup'ikZimbabwean
Immigration
NonimmigrantsImmigrantsAfghanistanAfricaArgentinaArmeniaAsiaAustraliaAustriaBahamasBangladeshBarbadosBelarusBelgiumBelizeBoliviaBosnia and HerzegovinaBrazilBulgariaBurma/MyanmarCabo VerdeCambodiaCameroonCanadaCaribbeanCentral AmericaChileChinaColombiaCongoCosta RicaCroatiaCubaCzechoslovakiaDenmarkDominicaDominican RepublicEastern AfricaEastern AsiaEastern EuropeEcuadorEgyptEl SalvadorEnglandEritreaEthiopiaEuropeFijiFranceGermanyGhanaGreeceGrenadaGuatemalaGuyanaHaitiHondurasHong KongHungaryIndiaIndonesiaIranIraqIrelandIsraelItalyJamaicaJapanJordanKazakhstanKenyaKoreaKuwaitLaosLatin AmericaLatviaLebanonLiberiaLithuaniaMalaysiaMexicoMicronesiaMiddle AfricaMoldovaMoroccoNepalNetherlandsNicaraguaNigeriaNorth AmericaNorth MacedoniaNorthern AfricaNorthern EuropeNorwayOceaniaPakistanPanamaPeruPhilippinesPolandPortugalRomaniaRussiaSaudi ArabiaScotlandSenegalSerbiaSierra LeoneSingaporeSomaliaSouth AfricaSouth AmericaSouth Central AsiaSouth Eastern AsiaSouthern EuropeSpainSri LankaSt. Vincent and the GrenadinesSudanSwedenSwitzerlandSyriaTaiwanThailandTrinidad and TobagoTurkeyUgandaUkraineUruguayUzbekistanVenezuelaVietnamWest IndiesWestern AfricaWestern AsiaWestern EuropeYemenZaireZimbabweAzores
Householder Income Ages 45 - 64 years
Income
Poverty
Unemployment
Labor Participation
Family Structure
Vehicle Availability
Education Level
Disability

Householder Income Ages 45 - 64 years Comparison

Immigrants from Albania

Immigrants from Norway

Good
Exceptional
$101,957
HOUSEHOLDER INCOME AGES 45 - 64 YEARS
69.4/ 100
METRIC RATING
165th/ 347
METRIC RANK
$111,669
HOUSEHOLDER INCOME AGES 45 - 64 YEARS
99.7/ 100
METRIC RATING
62nd/ 347
METRIC RANK

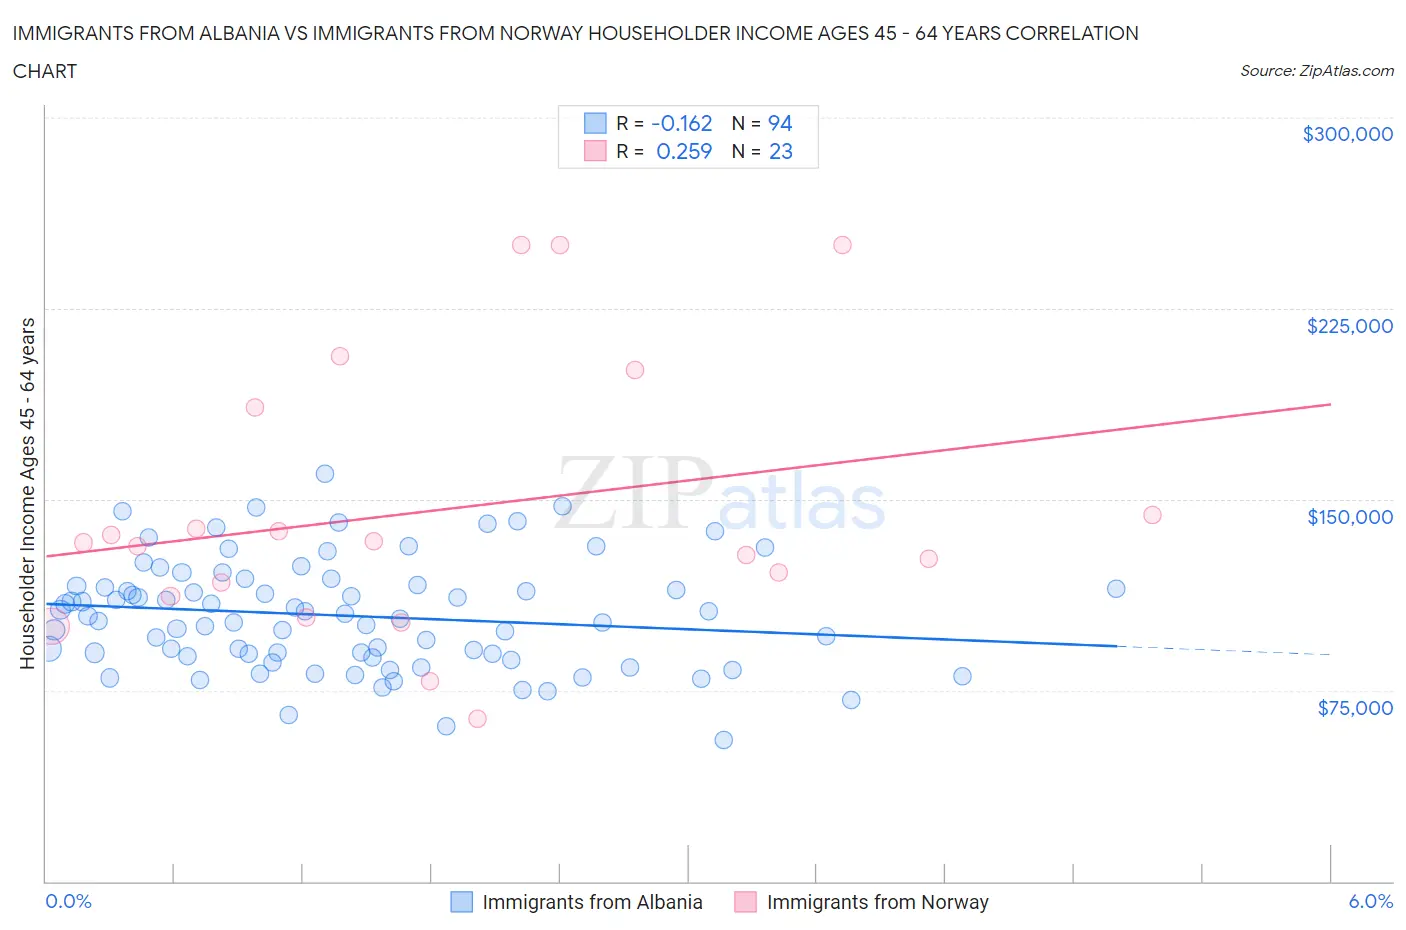
Immigrants from Albania vs Immigrants from Norway Householder Income Ages 45 - 64 years Correlation Chart

The statistical analysis conducted on geographies consisting of 119,310,676 people shows a poor negative correlation between the proportion of Immigrants from Albania and household income with householder between the ages 45 and 64 in the United States with a correlation coefficient (R) of -0.162 and weighted average of $101,957. Similarly, the statistical analysis conducted on geographies consisting of 116,657,782 people shows a weak positive correlation between the proportion of Immigrants from Norway and household income with householder between the ages 45 and 64 in the United States with a correlation coefficient (R) of 0.259 and weighted average of $111,669, a difference of 9.5%.
Immigrants from Albania vs Immigrants from Norway Householder Income Ages 45 - 64 years

Householder Income Ages 45 - 64 years Correlation Summary

MeasurementImmigrants from AlbaniaImmigrants from Norway
Minimum$55,673$63,891
Maximum$159,921$250,001
Range$104,248$186,110
Mean$104,200$145,670
Median$103,574$132,825
Interquartile 25% (IQ1)$88,350$111,854
Interquartile 75% (IQ3)$115,886$186,082
Interquartile Range (IQR)$27,536$74,228
Standard Deviation (Sample)$21,437$53,028
Standard Deviation (Population)$21,323$51,863

Similar Demographics by Householder Income Ages 45 - 64 years

Demographics Similar to Immigrants from Albania by Householder Income Ages 45 - 64 years

In terms of householder income ages 45 - 64 years, the demographic groups most similar to Immigrants from Albania are English ($102,021, a difference of 0.060%), Immigrants from Morocco ($102,015, a difference of 0.060%), Scottish ($102,123, a difference of 0.16%), Immigrants from Nepal ($102,190, a difference of 0.23%), and Icelander ($102,261, a difference of 0.30%).
DemographicsRating | RankHouseholder Income Ages 45 - 64 years
Slavs
76.1
/100
|
#158
Good
$102,629
Sierra Leoneans
74.2
/100
|
#159
Good
$102,427
Icelanders
72.5
/100
|
#160
Good
$102,261
Immigrants | Nepal
71.8
/100
|
#161
Good
$102,190
Scottish
71.1
/100
|
#162
Good
$102,123
English
70.1
/100
|
#163
Good
$102,021
Immigrants | Morocco
70.0
/100
|
#164
Good
$102,015
Immigrants | Albania
69.4
/100
|
#165
Good
$101,957
Samoans
65.3
/100
|
#166
Good
$101,580
Czechoslovakians
63.0
/100
|
#167
Good
$101,387
South American Indians
60.5
/100
|
#168
Good
$101,171
Guamanians/Chamorros
60.5
/100
|
#169
Good
$101,170
Slovaks
58.8
/100
|
#170
Average
$101,029
South Americans
56.4
/100
|
#171
Average
$100,837
Immigrants | Uzbekistan
52.5
/100
|
#172
Average
$100,523

Demographics Similar to Immigrants from Norway by Householder Income Ages 45 - 64 years

In terms of householder income ages 45 - 64 years, the demographic groups most similar to Immigrants from Norway are Mongolian ($111,602, a difference of 0.060%), Immigrants from Latvia ($111,454, a difference of 0.19%), Immigrants from Belarus ($111,430, a difference of 0.21%), Immigrants from Czechoslovakia ($111,914, a difference of 0.22%), and Immigrants from Europe ($111,984, a difference of 0.28%).
DemographicsRating | RankHouseholder Income Ages 45 - 64 years
Lithuanians
99.8
/100
|
#55
Exceptional
$112,484
Egyptians
99.7
/100
|
#56
Exceptional
$112,256
Immigrants | Scotland
99.7
/100
|
#57
Exceptional
$112,175
Soviet Union
99.7
/100
|
#58
Exceptional
$112,008
Immigrants | Europe
99.7
/100
|
#59
Exceptional
$111,984
Immigrants | Netherlands
99.7
/100
|
#60
Exceptional
$111,982
Immigrants | Czechoslovakia
99.7
/100
|
#61
Exceptional
$111,914
Immigrants | Norway
99.7
/100
|
#62
Exceptional
$111,669
Mongolians
99.6
/100
|
#63
Exceptional
$111,602
Immigrants | Latvia
99.6
/100
|
#64
Exceptional
$111,454
Immigrants | Belarus
99.6
/100
|
#65
Exceptional
$111,430
New Zealanders
99.6
/100
|
#66
Exceptional
$111,286
Laotians
99.5
/100
|
#67
Exceptional
$111,051
Immigrants | Romania
99.4
/100
|
#68
Exceptional
$110,633
Immigrants | Italy
99.4
/100
|
#69
Exceptional
$110,434