Immigrants from Albania vs Salvadoran Householder Income Ages 45 - 64 years
COMPARE
Immigrants from Albania
Salvadoran
Householder Income Ages 45 - 64 years
Householder Income Ages 45 - 64 years Comparison
Immigrants from Albania
Salvadorans
$101,957
HOUSEHOLDER INCOME AGES 45 - 64 YEARS
69.4/ 100
METRIC RATING
165th/ 347
METRIC RANK
$94,842
HOUSEHOLDER INCOME AGES 45 - 64 YEARS
6.0/ 100
METRIC RATING
220th/ 347
METRIC RANK
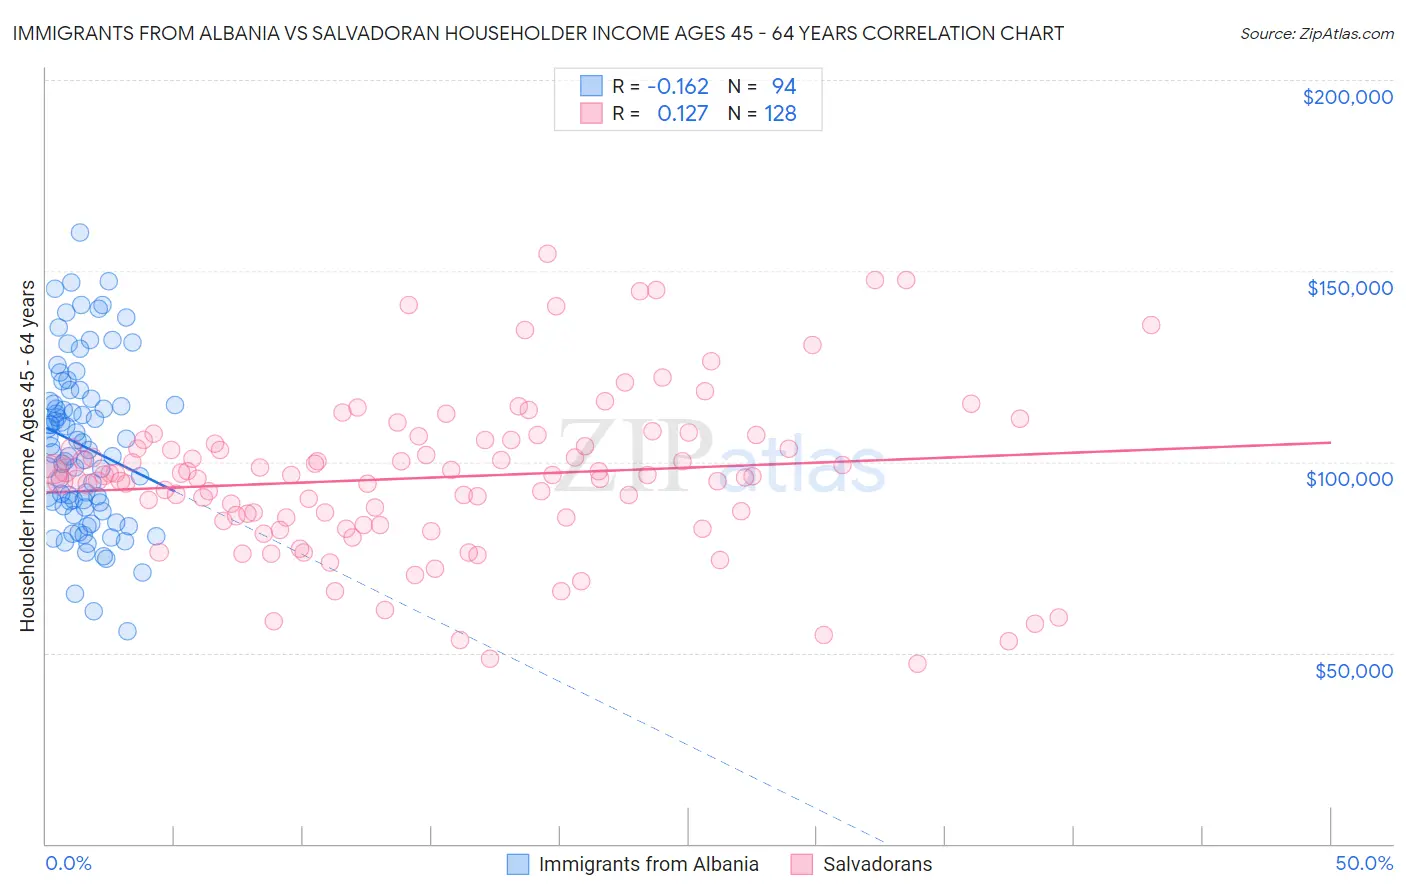
Immigrants from Albania vs Salvadoran Householder Income Ages 45 - 64 years Correlation Chart
The statistical analysis conducted on geographies consisting of 119,310,676 people shows a poor negative correlation between the proportion of Immigrants from Albania and household income with householder between the ages 45 and 64 in the United States with a correlation coefficient (R) of -0.162 and weighted average of $101,957. Similarly, the statistical analysis conducted on geographies consisting of 398,191,339 people shows a poor positive correlation between the proportion of Salvadorans and household income with householder between the ages 45 and 64 in the United States with a correlation coefficient (R) of 0.127 and weighted average of $94,842, a difference of 7.5%.
Householder Income Ages 45 - 64 years Correlation Summary
| Measurement | Immigrants from Albania | Salvadoran |
| Minimum | $55,673 | $47,083 |
| Maximum | $159,921 | $154,565 |
| Range | $104,248 | $107,482 |
| Mean | $104,200 | $95,925 |
| Median | $103,574 | $96,593 |
| Interquartile 25% (IQ1) | $88,350 | $84,940 |
| Interquartile 75% (IQ3) | $115,886 | $105,324 |
| Interquartile Range (IQR) | $27,536 | $20,384 |
| Standard Deviation (Sample) | $21,437 | $20,754 |
| Standard Deviation (Population) | $21,323 | $20,673 |
Similar Demographics by Householder Income Ages 45 - 64 years
Demographics Similar to Immigrants from Albania by Householder Income Ages 45 - 64 years
In terms of householder income ages 45 - 64 years, the demographic groups most similar to Immigrants from Albania are English ($102,021, a difference of 0.060%), Immigrants from Morocco ($102,015, a difference of 0.060%), Scottish ($102,123, a difference of 0.16%), Immigrants from Nepal ($102,190, a difference of 0.23%), and Icelander ($102,261, a difference of 0.30%).
| Demographics | Rating | Rank | Householder Income Ages 45 - 64 years |
| Slavs | 76.1 /100 | #158 | Good $102,629 |
| Sierra Leoneans | 74.2 /100 | #159 | Good $102,427 |
| Icelanders | 72.5 /100 | #160 | Good $102,261 |
| Immigrants | Nepal | 71.8 /100 | #161 | Good $102,190 |
| Scottish | 71.1 /100 | #162 | Good $102,123 |
| English | 70.1 /100 | #163 | Good $102,021 |
| Immigrants | Morocco | 70.0 /100 | #164 | Good $102,015 |
| Immigrants | Albania | 69.4 /100 | #165 | Good $101,957 |
| Samoans | 65.3 /100 | #166 | Good $101,580 |
| Czechoslovakians | 63.0 /100 | #167 | Good $101,387 |
| South American Indians | 60.5 /100 | #168 | Good $101,171 |
| Guamanians/Chamorros | 60.5 /100 | #169 | Good $101,170 |
| Slovaks | 58.8 /100 | #170 | Average $101,029 |
| South Americans | 56.4 /100 | #171 | Average $100,837 |
| Immigrants | Uzbekistan | 52.5 /100 | #172 | Average $100,523 |
Demographics Similar to Salvadorans by Householder Income Ages 45 - 64 years
In terms of householder income ages 45 - 64 years, the demographic groups most similar to Salvadorans are Immigrants from Armenia ($94,863, a difference of 0.020%), Immigrants from Nigeria ($94,804, a difference of 0.040%), Delaware ($94,914, a difference of 0.080%), Immigrants from Ghana ($94,982, a difference of 0.15%), and Malaysian ($94,517, a difference of 0.34%).
| Demographics | Rating | Rank | Householder Income Ages 45 - 64 years |
| Immigrants | Uruguay | 10.7 /100 | #213 | Poor $96,086 |
| Panamanians | 10.6 /100 | #214 | Poor $96,066 |
| Nigerians | 8.2 /100 | #215 | Tragic $95,492 |
| Immigrants | Venezuela | 7.6 /100 | #216 | Tragic $95,342 |
| Immigrants | Ghana | 6.4 /100 | #217 | Tragic $94,982 |
| Delaware | 6.2 /100 | #218 | Tragic $94,914 |
| Immigrants | Armenia | 6.1 /100 | #219 | Tragic $94,863 |
| Salvadorans | 6.0 /100 | #220 | Tragic $94,842 |
| Immigrants | Nigeria | 5.9 /100 | #221 | Tragic $94,804 |
| Malaysians | 5.2 /100 | #222 | Tragic $94,517 |
| Immigrants | Nonimmigrants | 5.0 /100 | #223 | Tragic $94,448 |
| Immigrants | Bosnia and Herzegovina | 4.6 /100 | #224 | Tragic $94,288 |
| Bermudans | 4.4 /100 | #225 | Tragic $94,197 |
| Immigrants | Azores | 4.3 /100 | #226 | Tragic $94,138 |
| Alaska Natives | 4.0 /100 | #227 | Tragic $93,991 |