Immigrants from Oceania vs Immigrants from Norway Householder Income Ages 45 - 64 years
COMPARE
Immigrants from Oceania
Immigrants from Norway
Householder Income Ages 45 - 64 years
Householder Income Ages 45 - 64 years Comparison
Immigrants from Oceania
Immigrants from Norway
$103,705
HOUSEHOLDER INCOME AGES 45 - 64 YEARS
84.5/ 100
METRIC RATING
139th/ 347
METRIC RANK
$111,669
HOUSEHOLDER INCOME AGES 45 - 64 YEARS
99.7/ 100
METRIC RATING
62nd/ 347
METRIC RANK
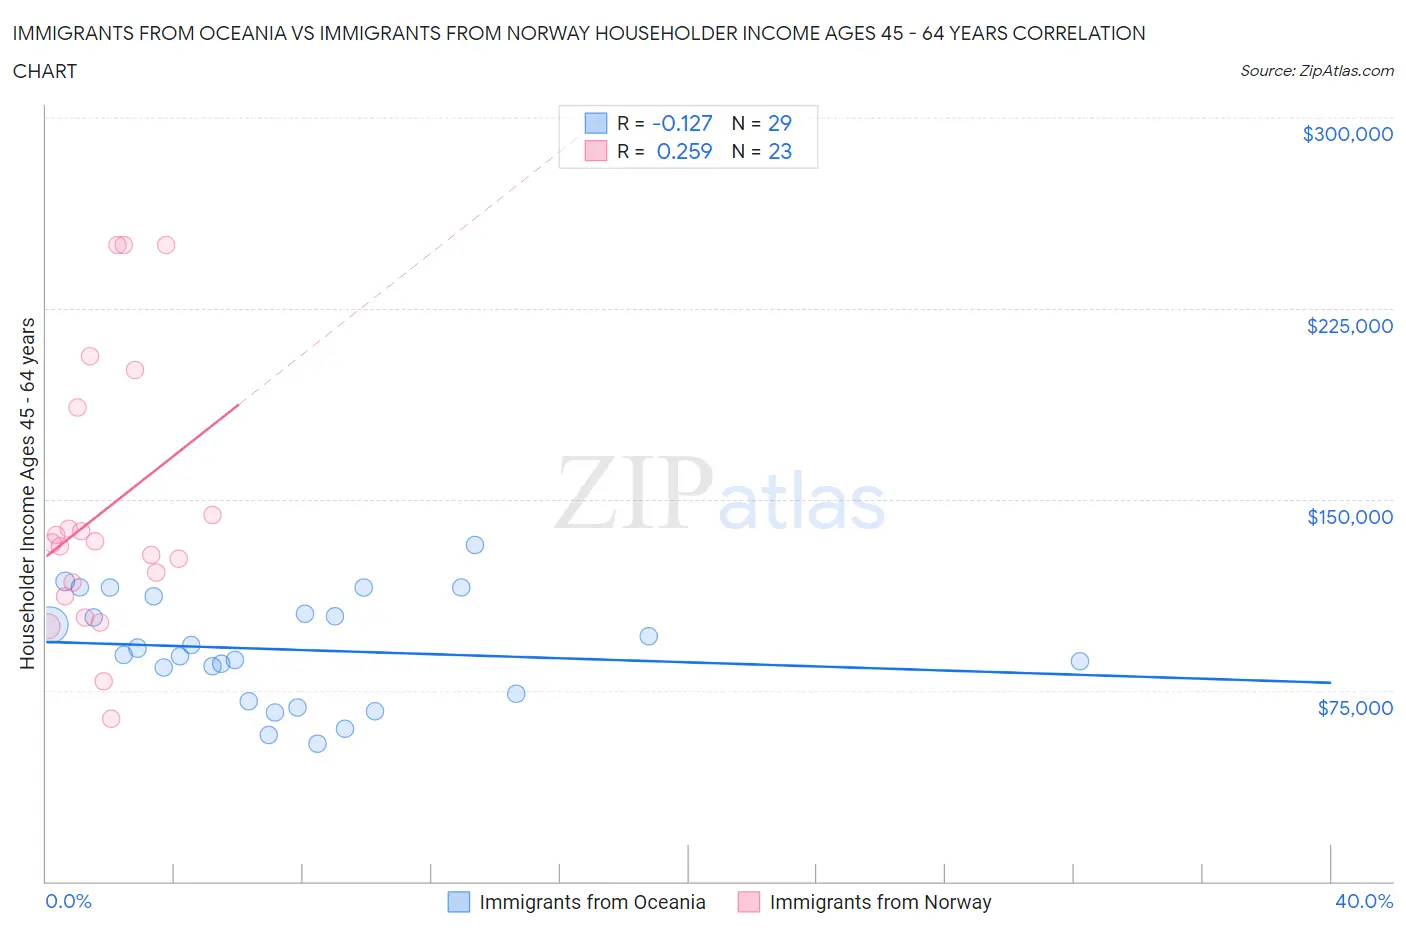
Immigrants from Oceania vs Immigrants from Norway Householder Income Ages 45 - 64 years Correlation Chart
The statistical analysis conducted on geographies consisting of 305,099,752 people shows a poor negative correlation between the proportion of Immigrants from Oceania and household income with householder between the ages 45 and 64 in the United States with a correlation coefficient (R) of -0.127 and weighted average of $103,705. Similarly, the statistical analysis conducted on geographies consisting of 116,657,782 people shows a weak positive correlation between the proportion of Immigrants from Norway and household income with householder between the ages 45 and 64 in the United States with a correlation coefficient (R) of 0.259 and weighted average of $111,669, a difference of 7.7%.
Householder Income Ages 45 - 64 years Correlation Summary
| Measurement | Immigrants from Oceania | Immigrants from Norway |
| Minimum | $53,935 | $63,891 |
| Maximum | $132,083 | $250,001 |
| Range | $78,148 | $186,110 |
| Mean | $90,991 | $145,670 |
| Median | $88,770 | $132,825 |
| Interquartile 25% (IQ1) | $72,125 | $111,854 |
| Interquartile 75% (IQ3) | $108,595 | $186,082 |
| Interquartile Range (IQR) | $36,470 | $74,228 |
| Standard Deviation (Sample) | $20,662 | $53,028 |
| Standard Deviation (Population) | $20,302 | $51,863 |
Similar Demographics by Householder Income Ages 45 - 64 years
Demographics Similar to Immigrants from Oceania by Householder Income Ages 45 - 64 years
In terms of householder income ages 45 - 64 years, the demographic groups most similar to Immigrants from Oceania are Norwegian ($103,682, a difference of 0.020%), Ethiopian ($103,736, a difference of 0.030%), Immigrants from Uganda ($103,584, a difference of 0.12%), Luxembourger ($103,536, a difference of 0.16%), and Serbian ($103,522, a difference of 0.18%).
| Demographics | Rating | Rank | Householder Income Ages 45 - 64 years |
| Lebanese | 90.1 /100 | #132 | Exceptional $104,734 |
| Arabs | 89.3 /100 | #133 | Excellent $104,566 |
| Canadians | 89.3 /100 | #134 | Excellent $104,560 |
| Brazilians | 88.6 /100 | #135 | Excellent $104,408 |
| Taiwanese | 87.4 /100 | #136 | Excellent $104,180 |
| Hungarians | 85.8 /100 | #137 | Excellent $103,913 |
| Ethiopians | 84.7 /100 | #138 | Excellent $103,736 |
| Immigrants | Oceania | 84.5 /100 | #139 | Excellent $103,705 |
| Norwegians | 84.3 /100 | #140 | Excellent $103,682 |
| Immigrants | Uganda | 83.7 /100 | #141 | Excellent $103,584 |
| Luxembourgers | 83.3 /100 | #142 | Excellent $103,536 |
| Serbians | 83.2 /100 | #143 | Excellent $103,522 |
| Czechs | 83.1 /100 | #144 | Excellent $103,507 |
| Ugandans | 82.9 /100 | #145 | Excellent $103,472 |
| Immigrants | Chile | 82.5 /100 | #146 | Excellent $103,412 |
Demographics Similar to Immigrants from Norway by Householder Income Ages 45 - 64 years
In terms of householder income ages 45 - 64 years, the demographic groups most similar to Immigrants from Norway are Mongolian ($111,602, a difference of 0.060%), Immigrants from Latvia ($111,454, a difference of 0.19%), Immigrants from Belarus ($111,430, a difference of 0.21%), Immigrants from Czechoslovakia ($111,914, a difference of 0.22%), and Immigrants from Europe ($111,984, a difference of 0.28%).
| Demographics | Rating | Rank | Householder Income Ages 45 - 64 years |
| Lithuanians | 99.8 /100 | #55 | Exceptional $112,484 |
| Egyptians | 99.7 /100 | #56 | Exceptional $112,256 |
| Immigrants | Scotland | 99.7 /100 | #57 | Exceptional $112,175 |
| Soviet Union | 99.7 /100 | #58 | Exceptional $112,008 |
| Immigrants | Europe | 99.7 /100 | #59 | Exceptional $111,984 |
| Immigrants | Netherlands | 99.7 /100 | #60 | Exceptional $111,982 |
| Immigrants | Czechoslovakia | 99.7 /100 | #61 | Exceptional $111,914 |
| Immigrants | Norway | 99.7 /100 | #62 | Exceptional $111,669 |
| Mongolians | 99.6 /100 | #63 | Exceptional $111,602 |
| Immigrants | Latvia | 99.6 /100 | #64 | Exceptional $111,454 |
| Immigrants | Belarus | 99.6 /100 | #65 | Exceptional $111,430 |
| New Zealanders | 99.6 /100 | #66 | Exceptional $111,286 |
| Laotians | 99.5 /100 | #67 | Exceptional $111,051 |
| Immigrants | Romania | 99.4 /100 | #68 | Exceptional $110,633 |
| Immigrants | Italy | 99.4 /100 | #69 | Exceptional $110,434 |