Central American Indian vs Immigrants from Norway Householder Income Ages 45 - 64 years
COMPARE
Central American Indian
Immigrants from Norway
Householder Income Ages 45 - 64 years
Householder Income Ages 45 - 64 years Comparison
Central American Indians
Immigrants from Norway
$86,764
HOUSEHOLDER INCOME AGES 45 - 64 YEARS
0.1/ 100
METRIC RATING
284th/ 347
METRIC RANK
$111,669
HOUSEHOLDER INCOME AGES 45 - 64 YEARS
99.7/ 100
METRIC RATING
62nd/ 347
METRIC RANK
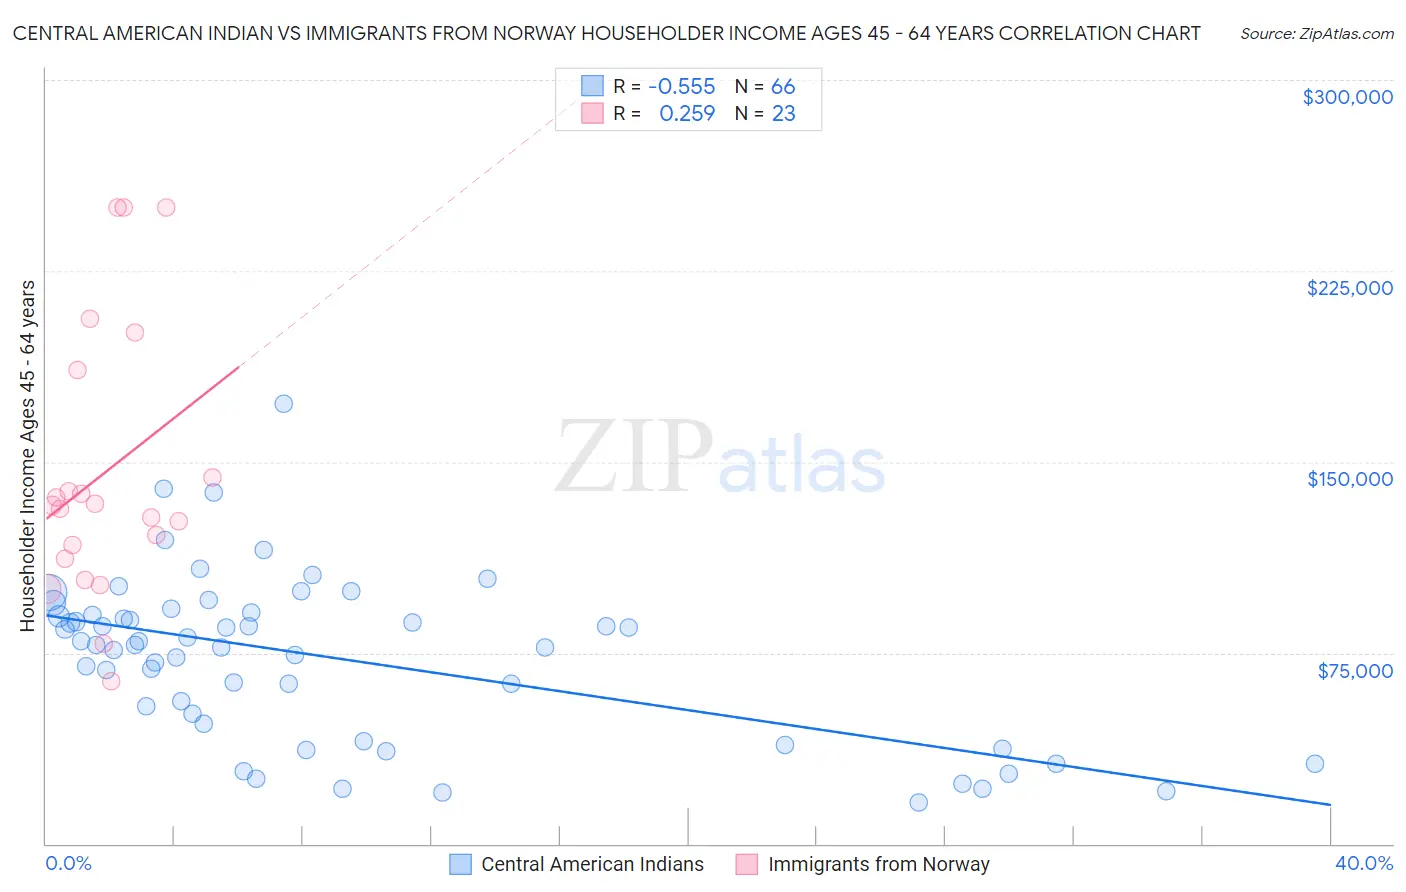
Central American Indian vs Immigrants from Norway Householder Income Ages 45 - 64 years Correlation Chart
The statistical analysis conducted on geographies consisting of 325,794,243 people shows a substantial negative correlation between the proportion of Central American Indians and household income with householder between the ages 45 and 64 in the United States with a correlation coefficient (R) of -0.555 and weighted average of $86,764. Similarly, the statistical analysis conducted on geographies consisting of 116,657,782 people shows a weak positive correlation between the proportion of Immigrants from Norway and household income with householder between the ages 45 and 64 in the United States with a correlation coefficient (R) of 0.259 and weighted average of $111,669, a difference of 28.7%.
Householder Income Ages 45 - 64 years Correlation Summary
| Measurement | Central American Indian | Immigrants from Norway |
| Minimum | $16,412 | $63,891 |
| Maximum | $173,000 | $250,001 |
| Range | $156,588 | $186,110 |
| Mean | $72,864 | $145,670 |
| Median | $78,027 | $132,825 |
| Interquartile 25% (IQ1) | $47,059 | $111,854 |
| Interquartile 75% (IQ3) | $90,095 | $186,082 |
| Interquartile Range (IQR) | $43,036 | $74,228 |
| Standard Deviation (Sample) | $32,226 | $53,028 |
| Standard Deviation (Population) | $31,981 | $51,863 |
Similar Demographics by Householder Income Ages 45 - 64 years
Demographics Similar to Central American Indians by Householder Income Ages 45 - 64 years
In terms of householder income ages 45 - 64 years, the demographic groups most similar to Central American Indians are Mexican ($86,816, a difference of 0.060%), Senegalese ($86,897, a difference of 0.15%), Yaqui ($86,914, a difference of 0.17%), Blackfeet ($86,595, a difference of 0.20%), and Immigrants from Guatemala ($86,573, a difference of 0.22%).
| Demographics | Rating | Rank | Householder Income Ages 45 - 64 years |
| Cree | 0.1 /100 | #277 | Tragic $87,185 |
| Immigrants | Jamaica | 0.1 /100 | #278 | Tragic $87,035 |
| Yakama | 0.1 /100 | #279 | Tragic $86,992 |
| Immigrants | Somalia | 0.1 /100 | #280 | Tragic $86,987 |
| Yaqui | 0.1 /100 | #281 | Tragic $86,914 |
| Senegalese | 0.1 /100 | #282 | Tragic $86,897 |
| Mexicans | 0.1 /100 | #283 | Tragic $86,816 |
| Central American Indians | 0.1 /100 | #284 | Tragic $86,764 |
| Blackfeet | 0.1 /100 | #285 | Tragic $86,595 |
| Immigrants | Guatemala | 0.1 /100 | #286 | Tragic $86,573 |
| Bangladeshis | 0.1 /100 | #287 | Tragic $86,402 |
| Immigrants | St. Vincent and the Grenadines | 0.1 /100 | #288 | Tragic $86,394 |
| Cubans | 0.1 /100 | #289 | Tragic $86,301 |
| Cherokee | 0.1 /100 | #290 | Tragic $86,125 |
| Hispanics or Latinos | 0.1 /100 | #291 | Tragic $86,006 |
Demographics Similar to Immigrants from Norway by Householder Income Ages 45 - 64 years
In terms of householder income ages 45 - 64 years, the demographic groups most similar to Immigrants from Norway are Mongolian ($111,602, a difference of 0.060%), Immigrants from Latvia ($111,454, a difference of 0.19%), Immigrants from Belarus ($111,430, a difference of 0.21%), Immigrants from Czechoslovakia ($111,914, a difference of 0.22%), and Immigrants from Europe ($111,984, a difference of 0.28%).
| Demographics | Rating | Rank | Householder Income Ages 45 - 64 years |
| Lithuanians | 99.8 /100 | #55 | Exceptional $112,484 |
| Egyptians | 99.7 /100 | #56 | Exceptional $112,256 |
| Immigrants | Scotland | 99.7 /100 | #57 | Exceptional $112,175 |
| Soviet Union | 99.7 /100 | #58 | Exceptional $112,008 |
| Immigrants | Europe | 99.7 /100 | #59 | Exceptional $111,984 |
| Immigrants | Netherlands | 99.7 /100 | #60 | Exceptional $111,982 |
| Immigrants | Czechoslovakia | 99.7 /100 | #61 | Exceptional $111,914 |
| Immigrants | Norway | 99.7 /100 | #62 | Exceptional $111,669 |
| Mongolians | 99.6 /100 | #63 | Exceptional $111,602 |
| Immigrants | Latvia | 99.6 /100 | #64 | Exceptional $111,454 |
| Immigrants | Belarus | 99.6 /100 | #65 | Exceptional $111,430 |
| New Zealanders | 99.6 /100 | #66 | Exceptional $111,286 |
| Laotians | 99.5 /100 | #67 | Exceptional $111,051 |
| Immigrants | Romania | 99.4 /100 | #68 | Exceptional $110,633 |
| Immigrants | Italy | 99.4 /100 | #69 | Exceptional $110,434 |