Delaware vs Immigrants from Norway Householder Income Ages 45 - 64 years
COMPARE
Delaware
Immigrants from Norway
Householder Income Ages 45 - 64 years
Householder Income Ages 45 - 64 years Comparison
Delaware
Immigrants from Norway
$94,914
HOUSEHOLDER INCOME AGES 45 - 64 YEARS
6.2/ 100
METRIC RATING
218th/ 347
METRIC RANK
$111,669
HOUSEHOLDER INCOME AGES 45 - 64 YEARS
99.7/ 100
METRIC RATING
62nd/ 347
METRIC RANK
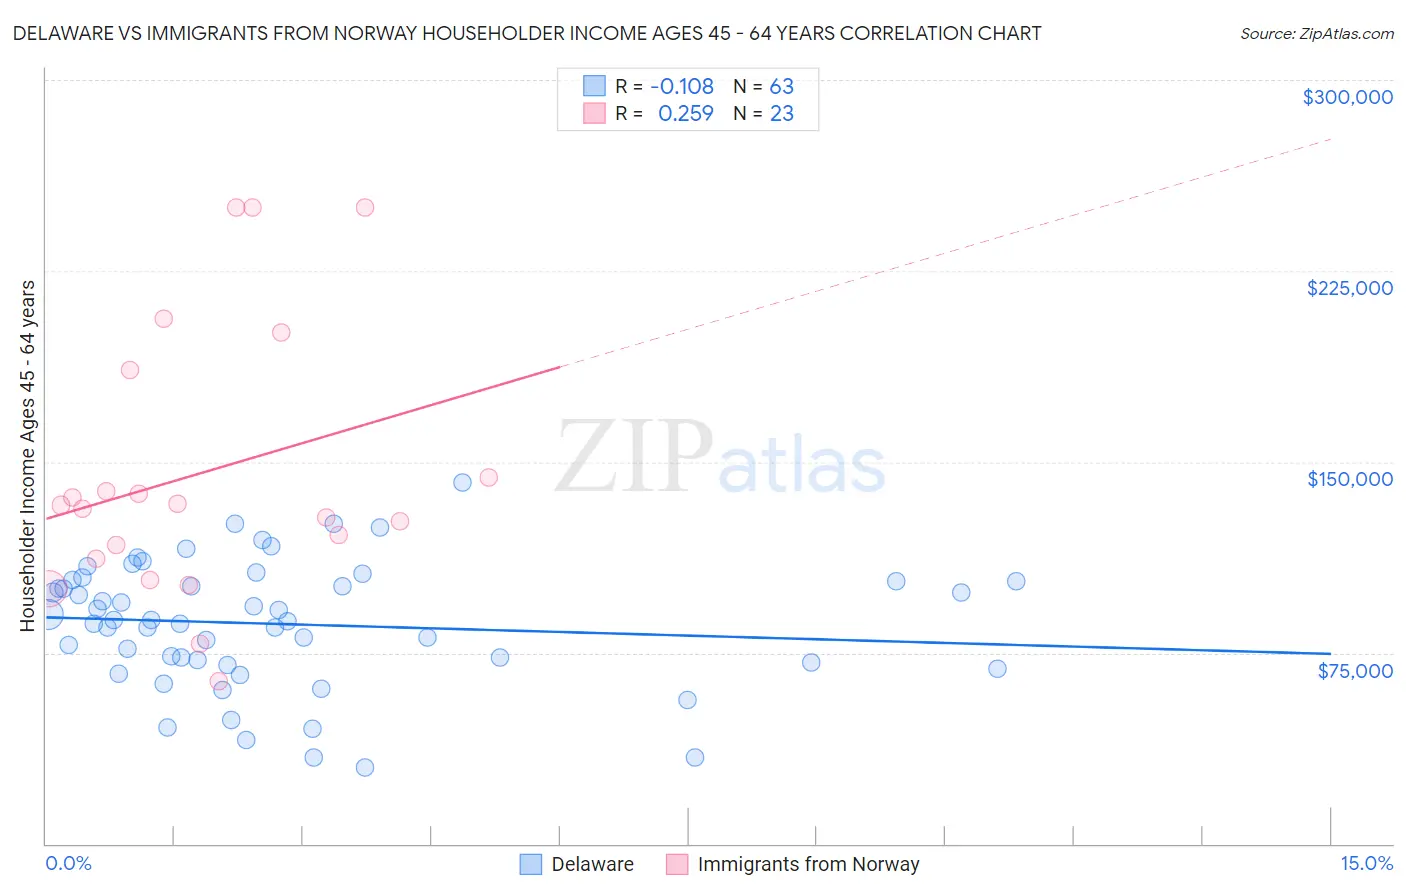
Delaware vs Immigrants from Norway Householder Income Ages 45 - 64 years Correlation Chart
The statistical analysis conducted on geographies consisting of 96,163,125 people shows a poor negative correlation between the proportion of Delaware and household income with householder between the ages 45 and 64 in the United States with a correlation coefficient (R) of -0.108 and weighted average of $94,914. Similarly, the statistical analysis conducted on geographies consisting of 116,657,782 people shows a weak positive correlation between the proportion of Immigrants from Norway and household income with householder between the ages 45 and 64 in the United States with a correlation coefficient (R) of 0.259 and weighted average of $111,669, a difference of 17.6%.
Householder Income Ages 45 - 64 years Correlation Summary
| Measurement | Delaware | Immigrants from Norway |
| Minimum | $29,844 | $63,891 |
| Maximum | $141,667 | $250,001 |
| Range | $111,823 | $186,110 |
| Mean | $86,309 | $145,670 |
| Median | $87,768 | $132,825 |
| Interquartile 25% (IQ1) | $71,250 | $111,854 |
| Interquartile 75% (IQ3) | $103,023 | $186,082 |
| Interquartile Range (IQR) | $31,773 | $74,228 |
| Standard Deviation (Sample) | $24,513 | $53,028 |
| Standard Deviation (Population) | $24,318 | $51,863 |
Similar Demographics by Householder Income Ages 45 - 64 years
Demographics Similar to Delaware by Householder Income Ages 45 - 64 years
In terms of householder income ages 45 - 64 years, the demographic groups most similar to Delaware are Immigrants from Armenia ($94,863, a difference of 0.050%), Immigrants from Ghana ($94,982, a difference of 0.070%), Salvadoran ($94,842, a difference of 0.080%), Immigrants from Nigeria ($94,804, a difference of 0.12%), and Malaysian ($94,517, a difference of 0.42%).
| Demographics | Rating | Rank | Householder Income Ages 45 - 64 years |
| Immigrants | Cambodia | 13.0 /100 | #211 | Poor $96,537 |
| Venezuelans | 12.6 /100 | #212 | Poor $96,460 |
| Immigrants | Uruguay | 10.7 /100 | #213 | Poor $96,086 |
| Panamanians | 10.6 /100 | #214 | Poor $96,066 |
| Nigerians | 8.2 /100 | #215 | Tragic $95,492 |
| Immigrants | Venezuela | 7.6 /100 | #216 | Tragic $95,342 |
| Immigrants | Ghana | 6.4 /100 | #217 | Tragic $94,982 |
| Delaware | 6.2 /100 | #218 | Tragic $94,914 |
| Immigrants | Armenia | 6.1 /100 | #219 | Tragic $94,863 |
| Salvadorans | 6.0 /100 | #220 | Tragic $94,842 |
| Immigrants | Nigeria | 5.9 /100 | #221 | Tragic $94,804 |
| Malaysians | 5.2 /100 | #222 | Tragic $94,517 |
| Immigrants | Nonimmigrants | 5.0 /100 | #223 | Tragic $94,448 |
| Immigrants | Bosnia and Herzegovina | 4.6 /100 | #224 | Tragic $94,288 |
| Bermudans | 4.4 /100 | #225 | Tragic $94,197 |
Demographics Similar to Immigrants from Norway by Householder Income Ages 45 - 64 years
In terms of householder income ages 45 - 64 years, the demographic groups most similar to Immigrants from Norway are Mongolian ($111,602, a difference of 0.060%), Immigrants from Latvia ($111,454, a difference of 0.19%), Immigrants from Belarus ($111,430, a difference of 0.21%), Immigrants from Czechoslovakia ($111,914, a difference of 0.22%), and Immigrants from Europe ($111,984, a difference of 0.28%).
| Demographics | Rating | Rank | Householder Income Ages 45 - 64 years |
| Lithuanians | 99.8 /100 | #55 | Exceptional $112,484 |
| Egyptians | 99.7 /100 | #56 | Exceptional $112,256 |
| Immigrants | Scotland | 99.7 /100 | #57 | Exceptional $112,175 |
| Soviet Union | 99.7 /100 | #58 | Exceptional $112,008 |
| Immigrants | Europe | 99.7 /100 | #59 | Exceptional $111,984 |
| Immigrants | Netherlands | 99.7 /100 | #60 | Exceptional $111,982 |
| Immigrants | Czechoslovakia | 99.7 /100 | #61 | Exceptional $111,914 |
| Immigrants | Norway | 99.7 /100 | #62 | Exceptional $111,669 |
| Mongolians | 99.6 /100 | #63 | Exceptional $111,602 |
| Immigrants | Latvia | 99.6 /100 | #64 | Exceptional $111,454 |
| Immigrants | Belarus | 99.6 /100 | #65 | Exceptional $111,430 |
| New Zealanders | 99.6 /100 | #66 | Exceptional $111,286 |
| Laotians | 99.5 /100 | #67 | Exceptional $111,051 |
| Immigrants | Romania | 99.4 /100 | #68 | Exceptional $110,633 |
| Immigrants | Italy | 99.4 /100 | #69 | Exceptional $110,434 |