Immigrants from Albania vs Immigrants from Norway Median Female Earnings
COMPARE
Immigrants from Albania
Immigrants from Norway
Median Female Earnings
Median Female Earnings Comparison
Immigrants from Albania
Immigrants from Norway
$42,388
MEDIAN FEMALE EARNINGS
99.6/ 100
METRIC RATING
77th/ 347
METRIC RANK
$42,837
MEDIAN FEMALE EARNINGS
99.9/ 100
METRIC RATING
66th/ 347
METRIC RANK
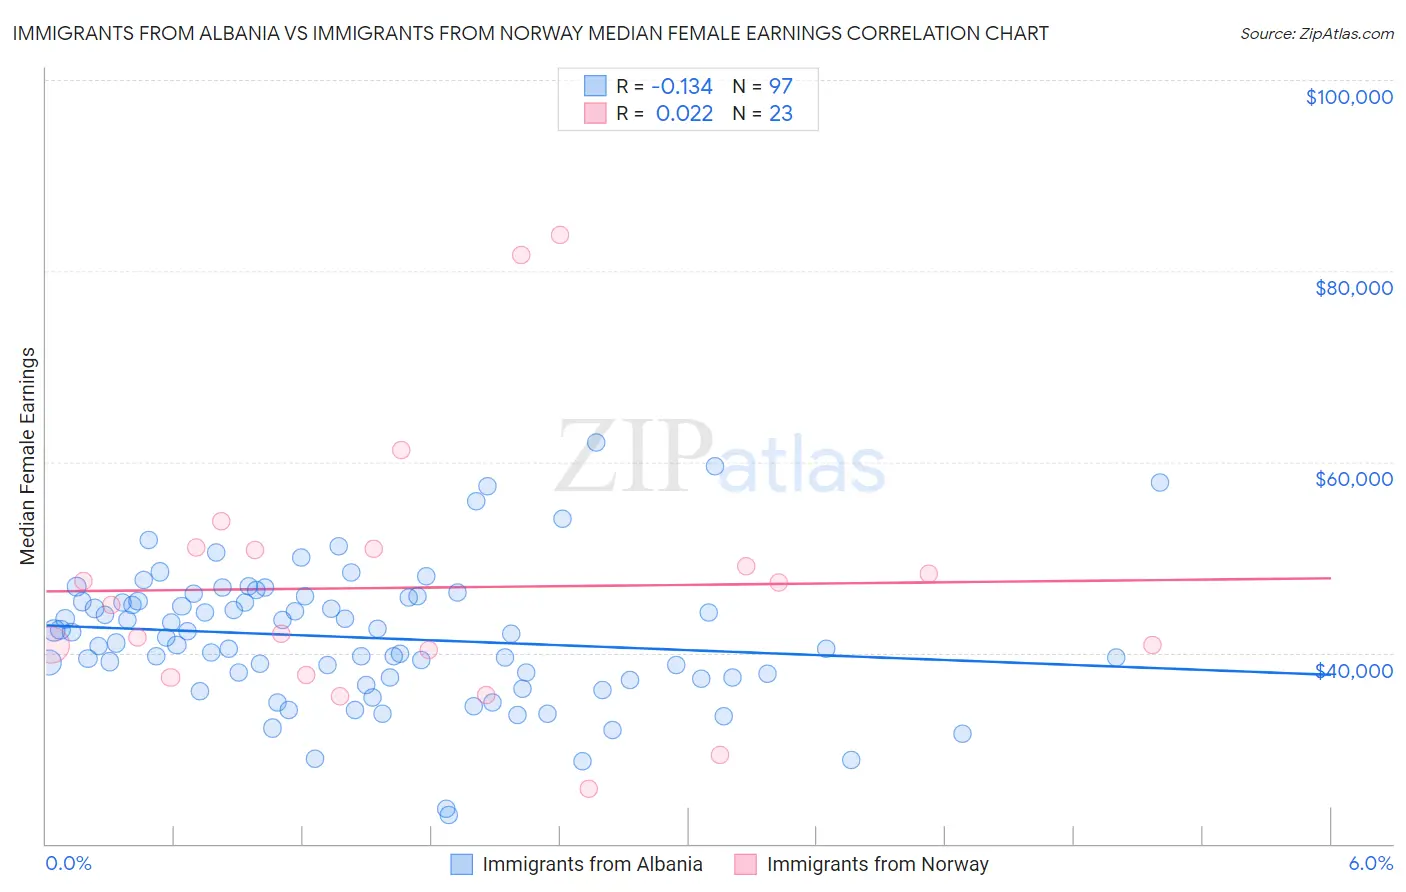
Immigrants from Albania vs Immigrants from Norway Median Female Earnings Correlation Chart
The statistical analysis conducted on geographies consisting of 119,358,863 people shows a poor negative correlation between the proportion of Immigrants from Albania and median female earnings in the United States with a correlation coefficient (R) of -0.134 and weighted average of $42,388. Similarly, the statistical analysis conducted on geographies consisting of 116,697,364 people shows no correlation between the proportion of Immigrants from Norway and median female earnings in the United States with a correlation coefficient (R) of 0.022 and weighted average of $42,837, a difference of 1.1%.
Median Female Earnings Correlation Summary
| Measurement | Immigrants from Albania | Immigrants from Norway |
| Minimum | $23,074 | $25,783 |
| Maximum | $62,011 | $83,727 |
| Range | $38,937 | $57,944 |
| Mean | $41,579 | $46,834 |
| Median | $41,555 | $44,998 |
| Interquartile 25% (IQ1) | $37,330 | $37,628 |
| Interquartile 75% (IQ3) | $45,624 | $50,939 |
| Interquartile Range (IQR) | $8,295 | $13,311 |
| Standard Deviation (Sample) | $7,093 | $13,874 |
| Standard Deviation (Population) | $7,056 | $13,569 |
Demographics Similar to Immigrants from Albania and Immigrants from Norway by Median Female Earnings
In terms of median female earnings, the demographic groups most similar to Immigrants from Albania are Immigrants from Kazakhstan ($42,386, a difference of 0.0%), Greek ($42,336, a difference of 0.12%), New Zealander ($42,446, a difference of 0.14%), Immigrants from Italy ($42,446, a difference of 0.14%), and Immigrants from Moldova ($42,304, a difference of 0.20%). Similarly, the demographic groups most similar to Immigrants from Norway are Immigrants from Egypt ($42,837, a difference of 0.0%), Immigrants from Austria ($42,824, a difference of 0.030%), Immigrants from Spain ($42,815, a difference of 0.050%), Sierra Leonean ($42,868, a difference of 0.070%), and Immigrants from Ethiopia ($42,744, a difference of 0.22%).
| Demographics | Rating | Rank | Median Female Earnings |
| Immigrants | Bulgaria | 99.9 /100 | #61 | Exceptional $43,085 |
| Afghans | 99.9 /100 | #62 | Exceptional $43,077 |
| Immigrants | Ukraine | 99.9 /100 | #63 | Exceptional $43,069 |
| Immigrants | Pakistan | 99.9 /100 | #64 | Exceptional $43,052 |
| Sierra Leoneans | 99.9 /100 | #65 | Exceptional $42,868 |
| Immigrants | Norway | 99.9 /100 | #66 | Exceptional $42,837 |
| Immigrants | Egypt | 99.9 /100 | #67 | Exceptional $42,837 |
| Immigrants | Austria | 99.8 /100 | #68 | Exceptional $42,824 |
| Immigrants | Spain | 99.8 /100 | #69 | Exceptional $42,815 |
| Immigrants | Ethiopia | 99.8 /100 | #70 | Exceptional $42,744 |
| Immigrants | Romania | 99.8 /100 | #71 | Exceptional $42,718 |
| Albanians | 99.8 /100 | #72 | Exceptional $42,584 |
| Mongolians | 99.7 /100 | #73 | Exceptional $42,542 |
| Immigrants | South Africa | 99.7 /100 | #74 | Exceptional $42,508 |
| New Zealanders | 99.7 /100 | #75 | Exceptional $42,446 |
| Immigrants | Italy | 99.7 /100 | #76 | Exceptional $42,446 |
| Immigrants | Albania | 99.6 /100 | #77 | Exceptional $42,388 |
| Immigrants | Kazakhstan | 99.6 /100 | #78 | Exceptional $42,386 |
| Greeks | 99.6 /100 | #79 | Exceptional $42,336 |
| Immigrants | Moldova | 99.6 /100 | #80 | Exceptional $42,304 |
| Immigrants | Southern Europe | 99.5 /100 | #81 | Exceptional $42,275 |