Immigrants from Albania vs Immigrants from Norway Unemployment Among Ages 45 to 54 years
COMPARE
Immigrants from Albania
Immigrants from Norway
Unemployment Among Ages 45 to 54 years
Unemployment Among Ages 45 to 54 years Comparison
Immigrants from Albania
Immigrants from Norway
4.8%
UNEMPLOYMENT AMONG AGES 45 TO 54 YEARS
0.9/ 100
METRIC RATING
245th/ 347
METRIC RANK
4.7%
UNEMPLOYMENT AMONG AGES 45 TO 54 YEARS
4.8/ 100
METRIC RATING
225th/ 347
METRIC RANK
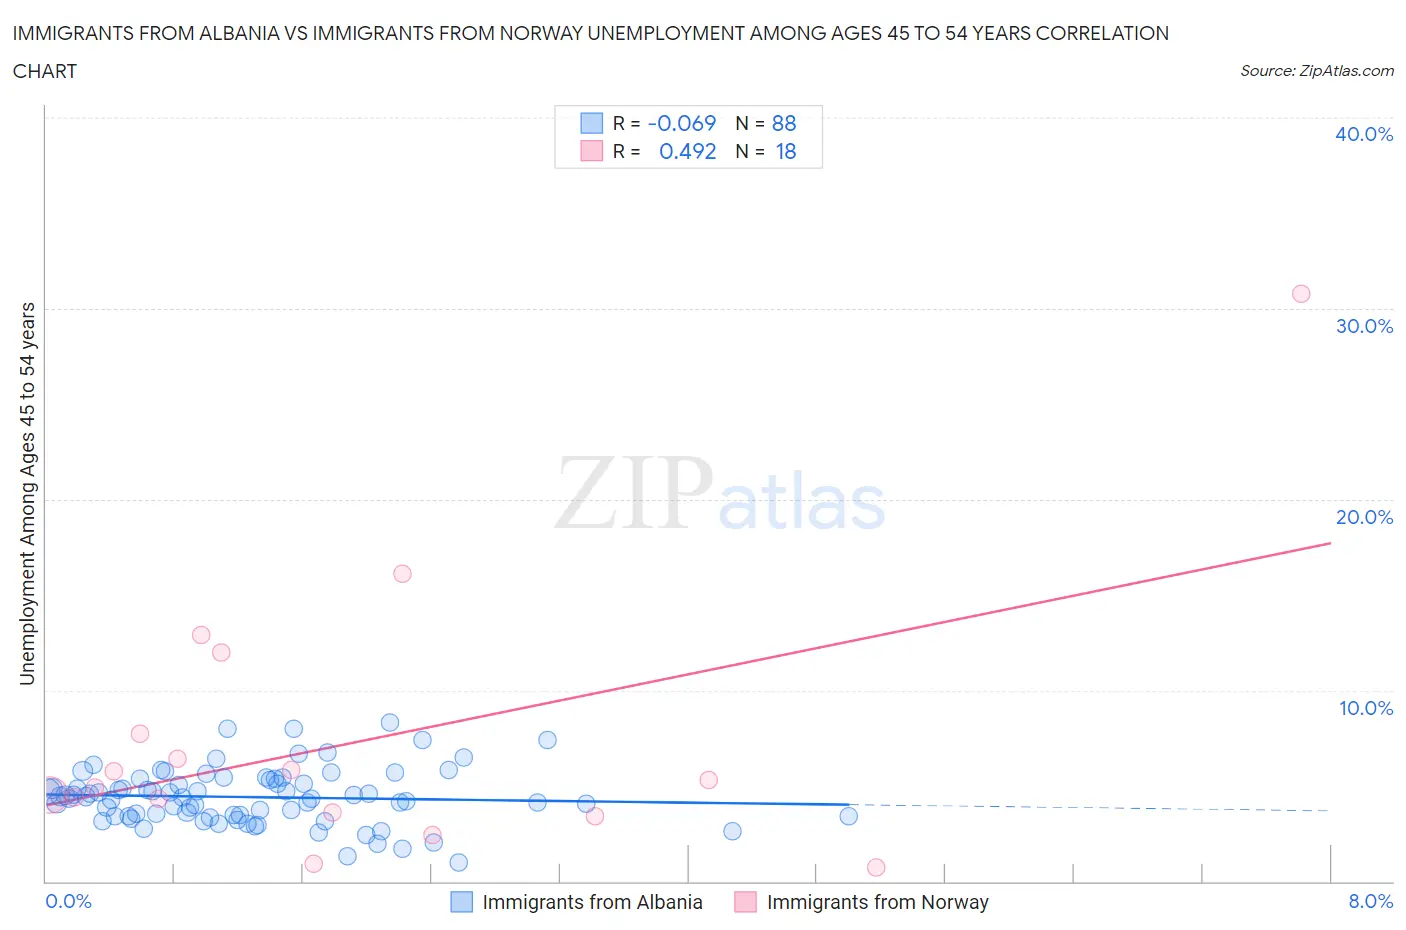
Immigrants from Albania vs Immigrants from Norway Unemployment Among Ages 45 to 54 years Correlation Chart
The statistical analysis conducted on geographies consisting of 118,397,124 people shows a slight negative correlation between the proportion of Immigrants from Albania and unemployment rate among population between the ages 45 and 54 in the United States with a correlation coefficient (R) of -0.069 and weighted average of 4.8%. Similarly, the statistical analysis conducted on geographies consisting of 115,484,514 people shows a moderate positive correlation between the proportion of Immigrants from Norway and unemployment rate among population between the ages 45 and 54 in the United States with a correlation coefficient (R) of 0.492 and weighted average of 4.7%, a difference of 1.9%.
Unemployment Among Ages 45 to 54 years Correlation Summary
| Measurement | Immigrants from Albania | Immigrants from Norway |
| Minimum | 1.0% | 0.70% |
| Maximum | 8.3% | 30.8% |
| Range | 7.3% | 30.1% |
| Mean | 4.4% | 7.3% |
| Median | 4.4% | 5.1% |
| Interquartile 25% (IQ1) | 3.4% | 3.6% |
| Interquartile 75% (IQ3) | 5.3% | 7.7% |
| Interquartile Range (IQR) | 1.9% | 4.1% |
| Standard Deviation (Sample) | 1.5% | 7.1% |
| Standard Deviation (Population) | 1.5% | 6.9% |
Demographics Similar to Immigrants from Albania and Immigrants from Norway by Unemployment Among Ages 45 to 54 years
In terms of unemployment among ages 45 to 54 years, the demographic groups most similar to Immigrants from Albania are Seminole (4.8%, a difference of 0.15%), Portuguese (4.8%, a difference of 0.21%), Delaware (4.8%, a difference of 0.32%), Central American (4.8%, a difference of 0.32%), and Immigrants from Iraq (4.7%, a difference of 0.39%). Similarly, the demographic groups most similar to Immigrants from Norway are Assyrian/Chaldean/Syriac (4.7%, a difference of 0.37%), Iraqi (4.7%, a difference of 0.46%), South American Indian (4.7%, a difference of 0.49%), Immigrants from Israel (4.7%, a difference of 0.54%), and Japanese (4.7%, a difference of 0.62%).
| Demographics | Rating | Rank | Unemployment Among Ages 45 to 54 years |
| Immigrants | Norway | 4.8 /100 | #225 | Tragic 4.7% |
| Assyrians/Chaldeans/Syriacs | 3.5 /100 | #226 | Tragic 4.7% |
| Iraqis | 3.2 /100 | #227 | Tragic 4.7% |
| South American Indians | 3.1 /100 | #228 | Tragic 4.7% |
| Immigrants | Israel | 3.0 /100 | #229 | Tragic 4.7% |
| Japanese | 2.8 /100 | #230 | Tragic 4.7% |
| Immigrants | Ireland | 2.7 /100 | #231 | Tragic 4.7% |
| Ottawa | 2.7 /100 | #232 | Tragic 4.7% |
| Immigrants | Immigrants | 2.6 /100 | #233 | Tragic 4.7% |
| Soviet Union | 2.6 /100 | #234 | Tragic 4.7% |
| Cree | 2.3 /100 | #235 | Tragic 4.7% |
| Tlingit-Haida | 2.3 /100 | #236 | Tragic 4.7% |
| Alsatians | 1.6 /100 | #237 | Tragic 4.7% |
| Yaqui | 1.4 /100 | #238 | Tragic 4.7% |
| Spanish Americans | 1.4 /100 | #239 | Tragic 4.7% |
| Immigrants | Iraq | 1.3 /100 | #240 | Tragic 4.7% |
| Delaware | 1.3 /100 | #241 | Tragic 4.8% |
| Central Americans | 1.3 /100 | #242 | Tragic 4.8% |
| Portuguese | 1.1 /100 | #243 | Tragic 4.8% |
| Seminole | 1.1 /100 | #244 | Tragic 4.8% |
| Immigrants | Albania | 0.9 /100 | #245 | Tragic 4.8% |