Immigrants from Albania vs Immigrants from Somalia Householder Income Ages 45 - 64 years
COMPARE
Immigrants from Albania
Immigrants from Somalia
Householder Income Ages 45 - 64 years
Householder Income Ages 45 - 64 years Comparison
Immigrants from Albania
Immigrants from Somalia
$101,957
HOUSEHOLDER INCOME AGES 45 - 64 YEARS
69.4/ 100
METRIC RATING
165th/ 347
METRIC RANK
$86,987
HOUSEHOLDER INCOME AGES 45 - 64 YEARS
0.1/ 100
METRIC RATING
280th/ 347
METRIC RANK
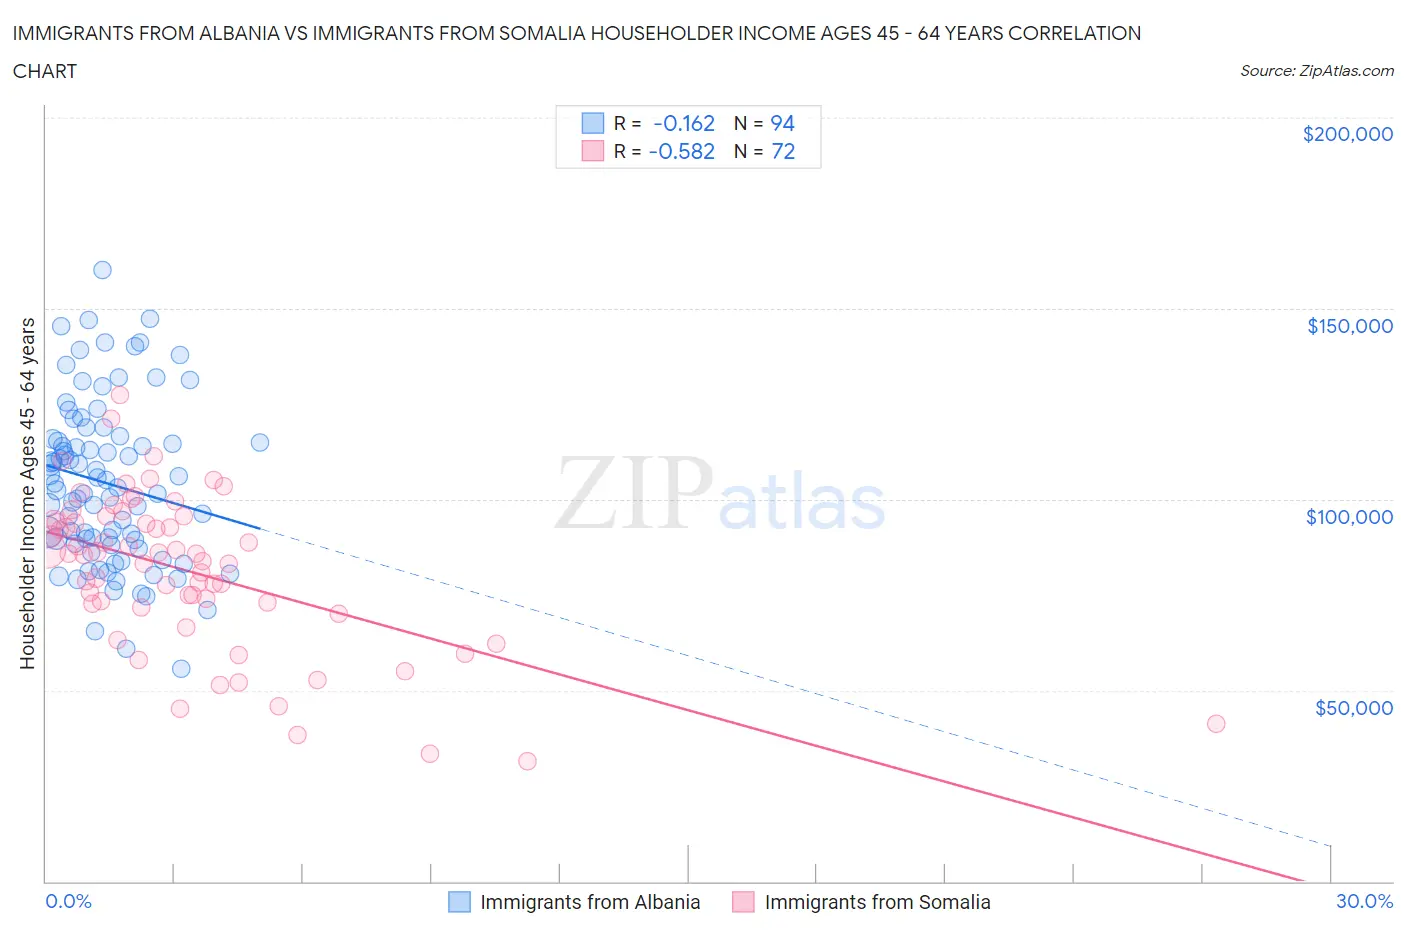
Immigrants from Albania vs Immigrants from Somalia Householder Income Ages 45 - 64 years Correlation Chart
The statistical analysis conducted on geographies consisting of 119,310,676 people shows a poor negative correlation between the proportion of Immigrants from Albania and household income with householder between the ages 45 and 64 in the United States with a correlation coefficient (R) of -0.162 and weighted average of $101,957. Similarly, the statistical analysis conducted on geographies consisting of 92,059,302 people shows a substantial negative correlation between the proportion of Immigrants from Somalia and household income with householder between the ages 45 and 64 in the United States with a correlation coefficient (R) of -0.582 and weighted average of $86,987, a difference of 17.2%.
Householder Income Ages 45 - 64 years Correlation Summary
| Measurement | Immigrants from Albania | Immigrants from Somalia |
| Minimum | $55,673 | $31,458 |
| Maximum | $159,921 | $127,433 |
| Range | $104,248 | $95,975 |
| Mean | $104,200 | $81,140 |
| Median | $103,574 | $85,605 |
| Interquartile 25% (IQ1) | $88,350 | $72,230 |
| Interquartile 75% (IQ3) | $115,886 | $94,234 |
| Interquartile Range (IQR) | $27,536 | $22,004 |
| Standard Deviation (Sample) | $21,437 | $20,209 |
| Standard Deviation (Population) | $21,323 | $20,068 |
Similar Demographics by Householder Income Ages 45 - 64 years
Demographics Similar to Immigrants from Albania by Householder Income Ages 45 - 64 years
In terms of householder income ages 45 - 64 years, the demographic groups most similar to Immigrants from Albania are English ($102,021, a difference of 0.060%), Immigrants from Morocco ($102,015, a difference of 0.060%), Scottish ($102,123, a difference of 0.16%), Immigrants from Nepal ($102,190, a difference of 0.23%), and Icelander ($102,261, a difference of 0.30%).
| Demographics | Rating | Rank | Householder Income Ages 45 - 64 years |
| Slavs | 76.1 /100 | #158 | Good $102,629 |
| Sierra Leoneans | 74.2 /100 | #159 | Good $102,427 |
| Icelanders | 72.5 /100 | #160 | Good $102,261 |
| Immigrants | Nepal | 71.8 /100 | #161 | Good $102,190 |
| Scottish | 71.1 /100 | #162 | Good $102,123 |
| English | 70.1 /100 | #163 | Good $102,021 |
| Immigrants | Morocco | 70.0 /100 | #164 | Good $102,015 |
| Immigrants | Albania | 69.4 /100 | #165 | Good $101,957 |
| Samoans | 65.3 /100 | #166 | Good $101,580 |
| Czechoslovakians | 63.0 /100 | #167 | Good $101,387 |
| South American Indians | 60.5 /100 | #168 | Good $101,171 |
| Guamanians/Chamorros | 60.5 /100 | #169 | Good $101,170 |
| Slovaks | 58.8 /100 | #170 | Average $101,029 |
| South Americans | 56.4 /100 | #171 | Average $100,837 |
| Immigrants | Uzbekistan | 52.5 /100 | #172 | Average $100,523 |
Demographics Similar to Immigrants from Somalia by Householder Income Ages 45 - 64 years
In terms of householder income ages 45 - 64 years, the demographic groups most similar to Immigrants from Somalia are Yakama ($86,992, a difference of 0.010%), Immigrants from Jamaica ($87,035, a difference of 0.050%), Yaqui ($86,914, a difference of 0.080%), Senegalese ($86,897, a difference of 0.10%), and Mexican ($86,816, a difference of 0.20%).
| Demographics | Rating | Rank | Householder Income Ages 45 - 64 years |
| Spanish American Indians | 0.2 /100 | #273 | Tragic $87,561 |
| Iroquois | 0.1 /100 | #274 | Tragic $87,255 |
| Immigrants | Belize | 0.1 /100 | #275 | Tragic $87,229 |
| Immigrants | Latin America | 0.1 /100 | #276 | Tragic $87,219 |
| Cree | 0.1 /100 | #277 | Tragic $87,185 |
| Immigrants | Jamaica | 0.1 /100 | #278 | Tragic $87,035 |
| Yakama | 0.1 /100 | #279 | Tragic $86,992 |
| Immigrants | Somalia | 0.1 /100 | #280 | Tragic $86,987 |
| Yaqui | 0.1 /100 | #281 | Tragic $86,914 |
| Senegalese | 0.1 /100 | #282 | Tragic $86,897 |
| Mexicans | 0.1 /100 | #283 | Tragic $86,816 |
| Central American Indians | 0.1 /100 | #284 | Tragic $86,764 |
| Blackfeet | 0.1 /100 | #285 | Tragic $86,595 |
| Immigrants | Guatemala | 0.1 /100 | #286 | Tragic $86,573 |
| Bangladeshis | 0.1 /100 | #287 | Tragic $86,402 |