Icelander vs Indonesian Median Household Income
COMPARE
Icelander
Indonesian
Median Household Income
Median Household Income Comparison
Icelanders
Indonesians
$85,797
MEDIAN HOUSEHOLD INCOME
61.0/ 100
METRIC RATING
168th/ 347
METRIC RANK
$72,856
MEDIAN HOUSEHOLD INCOME
0.0/ 100
METRIC RATING
299th/ 347
METRIC RANK
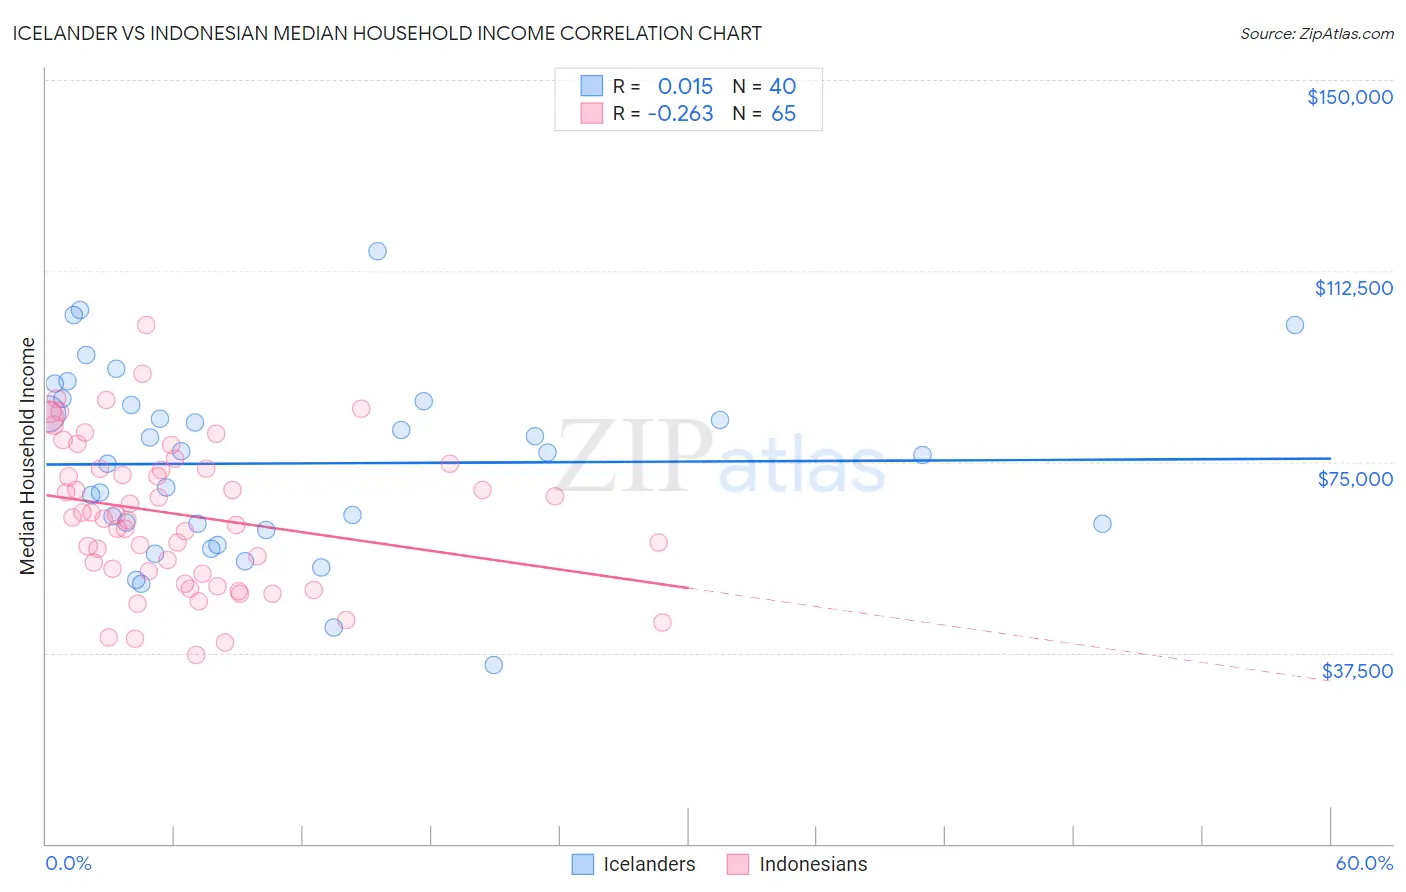
Icelander vs Indonesian Median Household Income Correlation Chart
The statistical analysis conducted on geographies consisting of 159,599,934 people shows no correlation between the proportion of Icelanders and median household income in the United States with a correlation coefficient (R) of 0.015 and weighted average of $85,797. Similarly, the statistical analysis conducted on geographies consisting of 162,609,195 people shows a weak negative correlation between the proportion of Indonesians and median household income in the United States with a correlation coefficient (R) of -0.263 and weighted average of $72,856, a difference of 17.8%.
Median Household Income Correlation Summary
| Measurement | Icelander | Indonesian |
| Minimum | $35,179 | $36,966 |
| Maximum | $116,250 | $101,767 |
| Range | $81,071 | $64,801 |
| Mean | $74,702 | $64,599 |
| Median | $76,562 | $64,081 |
| Interquartile 25% (IQ1) | $62,204 | $53,194 |
| Interquartile 75% (IQ3) | $86,541 | $74,214 |
| Interquartile Range (IQR) | $24,337 | $21,021 |
| Standard Deviation (Sample) | $17,966 | $14,432 |
| Standard Deviation (Population) | $17,740 | $14,321 |
Similar Demographics by Median Household Income
Demographics Similar to Icelanders by Median Household Income
In terms of median household income, the demographic groups most similar to Icelanders are Immigrants ($85,818, a difference of 0.020%), Colombian ($85,716, a difference of 0.090%), Swiss ($85,681, a difference of 0.14%), Immigrants from South America ($85,611, a difference of 0.22%), and Slovene ($85,562, a difference of 0.27%).
| Demographics | Rating | Rank | Median Household Income |
| Slavs | 69.7 /100 | #161 | Good $86,398 |
| Guamanians/Chamorros | 67.7 /100 | #162 | Good $86,255 |
| Czechs | 66.4 /100 | #163 | Good $86,164 |
| Irish | 66.2 /100 | #164 | Good $86,145 |
| Norwegians | 65.3 /100 | #165 | Good $86,084 |
| Scandinavians | 65.1 /100 | #166 | Good $86,073 |
| Immigrants | Immigrants | 61.3 /100 | #167 | Good $85,818 |
| Icelanders | 61.0 /100 | #168 | Good $85,797 |
| Colombians | 59.7 /100 | #169 | Average $85,716 |
| Swiss | 59.2 /100 | #170 | Average $85,681 |
| Immigrants | South America | 58.1 /100 | #171 | Average $85,611 |
| Slovenes | 57.4 /100 | #172 | Average $85,562 |
| Immigrants | Cameroon | 53.4 /100 | #173 | Average $85,314 |
| Scottish | 50.0 /100 | #174 | Average $85,101 |
| Immigrants | Costa Rica | 49.2 /100 | #175 | Average $85,054 |
Demographics Similar to Indonesians by Median Household Income
In terms of median household income, the demographic groups most similar to Indonesians are Immigrants from Dominica ($72,760, a difference of 0.13%), Paiute ($72,959, a difference of 0.14%), Cherokee ($72,682, a difference of 0.24%), Shoshone ($72,660, a difference of 0.27%), and African ($72,650, a difference of 0.28%).
| Demographics | Rating | Rank | Median Household Income |
| Comanche | 0.1 /100 | #292 | Tragic $73,747 |
| Immigrants | Cabo Verde | 0.1 /100 | #293 | Tragic $73,515 |
| Blackfeet | 0.1 /100 | #294 | Tragic $73,509 |
| Cubans | 0.1 /100 | #295 | Tragic $73,392 |
| Haitians | 0.1 /100 | #296 | Tragic $73,306 |
| Immigrants | Mexico | 0.0 /100 | #297 | Tragic $73,160 |
| Paiute | 0.0 /100 | #298 | Tragic $72,959 |
| Indonesians | 0.0 /100 | #299 | Tragic $72,856 |
| Immigrants | Dominica | 0.0 /100 | #300 | Tragic $72,760 |
| Cherokee | 0.0 /100 | #301 | Tragic $72,682 |
| Shoshone | 0.0 /100 | #302 | Tragic $72,660 |
| Africans | 0.0 /100 | #303 | Tragic $72,650 |
| Immigrants | Haiti | 0.0 /100 | #304 | Tragic $72,599 |
| Hondurans | 0.0 /100 | #305 | Tragic $72,588 |
| Potawatomi | 0.0 /100 | #306 | Tragic $72,576 |