Icelander vs Tsimshian Median Household Income
COMPARE
Icelander
Tsimshian
Median Household Income
Median Household Income Comparison
Icelanders
Tsimshian
$85,797
MEDIAN HOUSEHOLD INCOME
61.0/ 100
METRIC RATING
168th/ 347
METRIC RANK
$83,346
MEDIAN HOUSEHOLD INCOME
24.5/ 100
METRIC RATING
200th/ 347
METRIC RANK
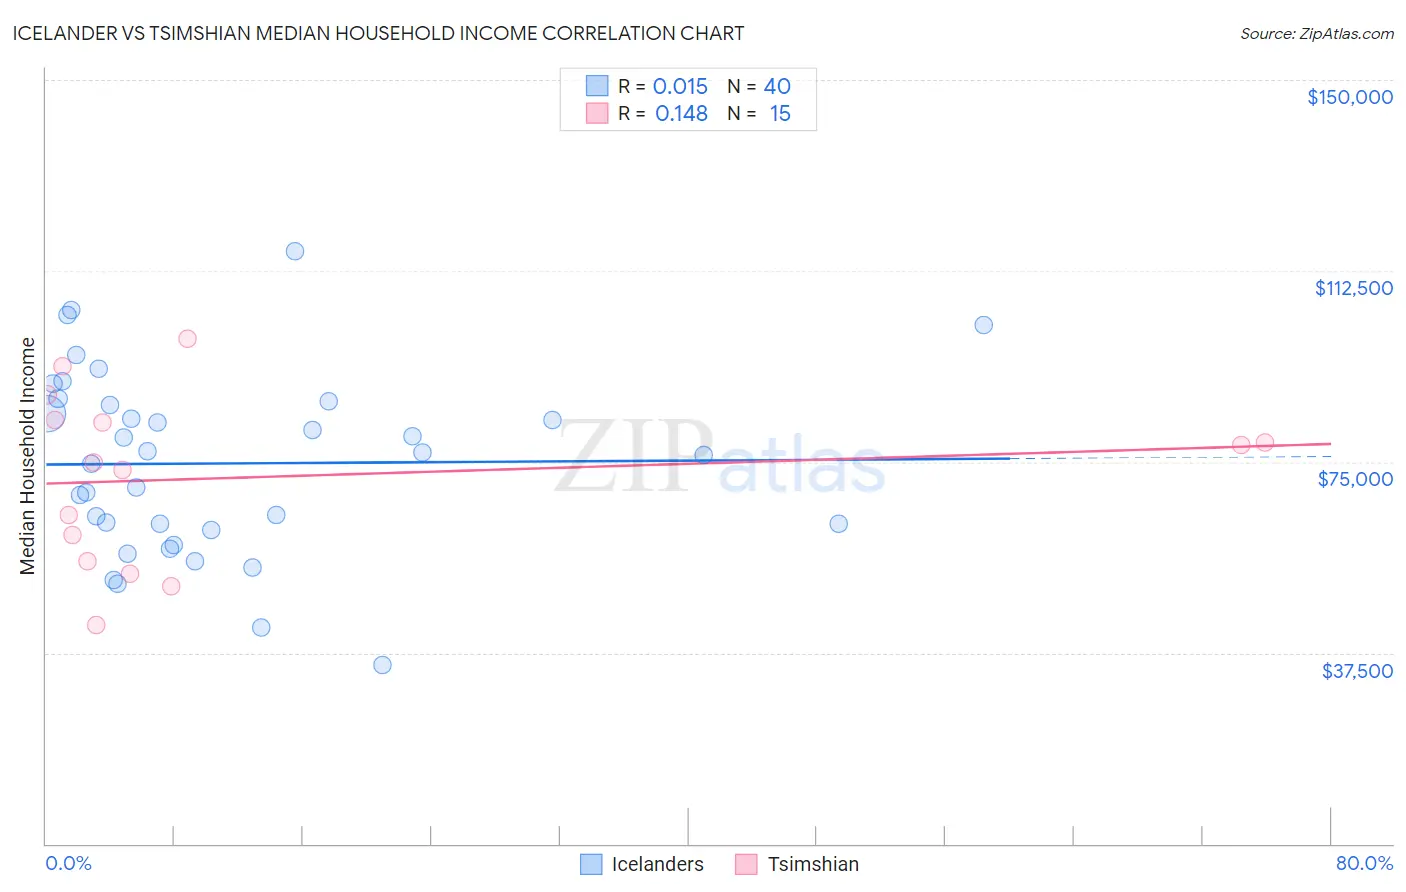
Icelander vs Tsimshian Median Household Income Correlation Chart
The statistical analysis conducted on geographies consisting of 159,599,934 people shows no correlation between the proportion of Icelanders and median household income in the United States with a correlation coefficient (R) of 0.015 and weighted average of $85,797. Similarly, the statistical analysis conducted on geographies consisting of 15,626,462 people shows a poor positive correlation between the proportion of Tsimshian and median household income in the United States with a correlation coefficient (R) of 0.148 and weighted average of $83,346, a difference of 2.9%.
Median Household Income Correlation Summary
| Measurement | Icelander | Tsimshian |
| Minimum | $35,179 | $42,857 |
| Maximum | $116,250 | $99,167 |
| Range | $81,071 | $56,310 |
| Mean | $74,702 | $71,994 |
| Median | $76,562 | $75,000 |
| Interquartile 25% (IQ1) | $62,204 | $55,448 |
| Interquartile 75% (IQ3) | $86,541 | $83,217 |
| Interquartile Range (IQR) | $24,337 | $27,769 |
| Standard Deviation (Sample) | $17,966 | $16,777 |
| Standard Deviation (Population) | $17,740 | $16,208 |
Similar Demographics by Median Household Income
Demographics Similar to Icelanders by Median Household Income
In terms of median household income, the demographic groups most similar to Icelanders are Immigrants ($85,818, a difference of 0.020%), Colombian ($85,716, a difference of 0.090%), Swiss ($85,681, a difference of 0.14%), Immigrants from South America ($85,611, a difference of 0.22%), and Slovene ($85,562, a difference of 0.27%).
| Demographics | Rating | Rank | Median Household Income |
| Slavs | 69.7 /100 | #161 | Good $86,398 |
| Guamanians/Chamorros | 67.7 /100 | #162 | Good $86,255 |
| Czechs | 66.4 /100 | #163 | Good $86,164 |
| Irish | 66.2 /100 | #164 | Good $86,145 |
| Norwegians | 65.3 /100 | #165 | Good $86,084 |
| Scandinavians | 65.1 /100 | #166 | Good $86,073 |
| Immigrants | Immigrants | 61.3 /100 | #167 | Good $85,818 |
| Icelanders | 61.0 /100 | #168 | Good $85,797 |
| Colombians | 59.7 /100 | #169 | Average $85,716 |
| Swiss | 59.2 /100 | #170 | Average $85,681 |
| Immigrants | South America | 58.1 /100 | #171 | Average $85,611 |
| Slovenes | 57.4 /100 | #172 | Average $85,562 |
| Immigrants | Cameroon | 53.4 /100 | #173 | Average $85,314 |
| Scottish | 50.0 /100 | #174 | Average $85,101 |
| Immigrants | Costa Rica | 49.2 /100 | #175 | Average $85,054 |
Demographics Similar to Tsimshian by Median Household Income
In terms of median household income, the demographic groups most similar to Tsimshian are Spanish ($83,343, a difference of 0.0%), German ($83,358, a difference of 0.010%), Immigrants from Thailand ($83,327, a difference of 0.020%), Immigrants from Cambodia ($83,304, a difference of 0.050%), and Japanese ($83,395, a difference of 0.060%).
| Demographics | Rating | Rank | Median Household Income |
| Finns | 27.7 /100 | #193 | Fair $83,607 |
| Ghanaians | 27.4 /100 | #194 | Fair $83,582 |
| Immigrants | Armenia | 27.0 /100 | #195 | Fair $83,555 |
| French | 26.0 /100 | #196 | Fair $83,468 |
| Aleuts | 25.7 /100 | #197 | Fair $83,446 |
| Japanese | 25.1 /100 | #198 | Fair $83,395 |
| Germans | 24.6 /100 | #199 | Fair $83,358 |
| Tsimshian | 24.5 /100 | #200 | Fair $83,346 |
| Spanish | 24.4 /100 | #201 | Fair $83,343 |
| Immigrants | Thailand | 24.3 /100 | #202 | Fair $83,327 |
| Immigrants | Cambodia | 24.0 /100 | #203 | Fair $83,304 |
| Immigrants | Africa | 23.8 /100 | #204 | Fair $83,289 |
| Celtics | 22.7 /100 | #205 | Fair $83,193 |
| Immigrants | Kenya | 21.3 /100 | #206 | Fair $83,068 |
| Dutch | 20.3 /100 | #207 | Fair $82,971 |