Immigrants from Israel vs Uruguayan Median Household Income

COMPARE

Immigrants from Israel
Race
Ancestry
AfghanAfricanAlaska NativeAlaskan AthabascanAlbanianAleutAlsatianAmericanApacheArabArapahoArgentineanArmenianAssyrian/Chaldean/SyriacAustralianAustrianBahamianBangladeshiBarbadianBasqueBelgianBelizeanBermudanBhutaneseBlackfeetBolivianBrazilianBritishBritish West IndianBulgarianBurmeseCajunCambodianCanadianCape VerdeanCarpatho RusynCelticCentral AmericanCentral American IndianCherokeeCheyenneChickasawChileanChineseChippewaChoctawColombianColvilleComancheCosta RicanCreeCreekCroatianCrowCubanCypriotCzechCzechoslovakianDanishDelawareDominicanDutchDutch West IndianEastern EuropeanEcuadorianEgyptianEnglishEstonianEthiopianEuropeanFijianFilipinoFinnishFrenchFrench American IndianFrench CanadianGermanGerman RussianGhanaianGreekGuamanian/ChamorroGuatemalanGuyaneseHaitianHmongHonduranHopiHoumaHungarianIcelanderIndian (Asian)IndonesianInupiatIranianIraqiIrishIroquoisIsraeliItalianJamaicanJapaneseJordanianKenyanKiowaKoreanLaotianLatvianLebaneseLiberianLithuanianLumbeeLuxembourgerMacedonianMalaysianMalteseMarshalleseMenomineeMexicanMexican American IndianMongolianMoroccanNative HawaiianNavajoNepaleseNew ZealanderNicaraguanNigerianNorthern EuropeanNorwegianOkinawanOsageOttawaPaiutePakistaniPalestinianPanamanianParaguayanPennsylvania GermanPeruvianPimaPolishPortuguesePotawatomiPuebloPuerto RicanPuget Sound SalishRomanianRussianSalvadoranSamoanScandinavianScotch-IrishScottishSeminoleSenegaleseSerbianShoshoneSierra LeoneanSiouxSlavicSlovakSloveneSomaliSouth AfricanSouth AmericanSouth American IndianSoviet UnionSpaniardSpanishSpanish AmericanSpanish American IndianSri LankanSubsaharan AfricanSudaneseSwedishSwissSyrianTaiwaneseThaiTlingit-HaidaTohono O'OdhamTonganTrinidadian and TobagonianTsimshianTurkishU.S. Virgin IslanderUgandanUkrainianUteVenezuelanVietnameseWelshWest IndianYakamaYaquiYugoslavianYumanYup'ikZimbabwean
Immigration
NonimmigrantsImmigrantsAfghanistanAfricaAlbaniaArgentinaArmeniaAsiaAustraliaAustriaBahamasBangladeshBarbadosBelarusBelgiumBelizeBoliviaBosnia and HerzegovinaBrazilBulgariaBurma/MyanmarCabo VerdeCambodiaCameroonCanadaCaribbeanCentral AmericaChileChinaColombiaCongoCosta RicaCroatiaCubaCzechoslovakiaDenmarkDominicaDominican RepublicEastern AfricaEastern AsiaEastern EuropeEcuadorEgyptEl SalvadorEnglandEritreaEthiopiaEuropeFijiFranceGermanyGhanaGreeceGrenadaGuatemalaGuyanaHaitiHondurasHong KongHungaryIndiaIndonesiaIranIraqIrelandIsraelItalyJamaicaJapanJordanKazakhstanKenyaKoreaKuwaitLaosLatin AmericaLatviaLebanonLiberiaLithuaniaMalaysiaMexicoMicronesiaMiddle AfricaMoldovaMoroccoNepalNetherlandsNicaraguaNigeriaNorth AmericaNorth MacedoniaNorthern AfricaNorthern EuropeNorwayOceaniaPakistanPanamaPeruPhilippinesPolandPortugalRomaniaRussiaSaudi ArabiaScotlandSenegalSerbiaSierra LeoneSingaporeSomaliaSouth AfricaSouth AmericaSouth Central AsiaSouth Eastern AsiaSouthern EuropeSpainSri LankaSt. Vincent and the GrenadinesSudanSwedenSwitzerlandSyriaTaiwanThailandTrinidad and TobagoTurkeyUgandaUkraineUruguayUzbekistanVenezuelaVietnamWest IndiesWestern AfricaWestern AsiaWestern EuropeYemenZaireZimbabweAzores
Uruguayan
Race
Ancestry
AfghanAfricanAlaska NativeAlaskan AthabascanAlbanianAleutAlsatianAmericanApacheArabArapahoArgentineanArmenianAssyrian/Chaldean/SyriacAustralianAustrianBahamianBangladeshiBarbadianBasqueBelgianBelizeanBermudanBhutaneseBlackfeetBolivianBrazilianBritishBritish West IndianBulgarianBurmeseCajunCambodianCanadianCape VerdeanCarpatho RusynCelticCentral AmericanCentral American IndianCherokeeCheyenneChickasawChileanChineseChippewaChoctawColombianColvilleComancheCosta RicanCreeCreekCroatianCrowCubanCypriotCzechCzechoslovakianDanishDelawareDominicanDutchDutch West IndianEastern EuropeanEcuadorianEgyptianEnglishEstonianEthiopianEuropeanFijianFilipinoFinnishFrenchFrench American IndianFrench CanadianGermanGerman RussianGhanaianGreekGuamanian/ChamorroGuatemalanGuyaneseHaitianHmongHonduranHopiHoumaHungarianIcelanderIndian (Asian)IndonesianInupiatIranianIraqiIrishIroquoisIsraeliItalianJamaicanJapaneseJordanianKenyanKiowaKoreanLaotianLatvianLebaneseLiberianLithuanianLumbeeLuxembourgerMacedonianMalaysianMalteseMarshalleseMenomineeMexicanMexican American IndianMongolianMoroccanNative HawaiianNavajoNepaleseNew ZealanderNicaraguanNigerianNorthern EuropeanNorwegianOkinawanOsageOttawaPaiutePakistaniPalestinianPanamanianParaguayanPennsylvania GermanPeruvianPimaPolishPortuguesePotawatomiPuebloPuerto RicanPuget Sound SalishRomanianRussianSalvadoranSamoanScandinavianScotch-IrishScottishSeminoleSenegaleseSerbianShoshoneSierra LeoneanSiouxSlavicSlovakSloveneSomaliSouth AfricanSouth AmericanSouth American IndianSoviet UnionSpaniardSpanishSpanish AmericanSpanish American IndianSri LankanSubsaharan AfricanSudaneseSwedishSwissSyrianTaiwaneseThaiTlingit-HaidaTohono O'OdhamTonganTrinidadian and TobagonianTsimshianTurkishU.S. Virgin IslanderUgandanUkrainianUruguayanUteVenezuelanVietnameseWelshWest IndianYakamaYaquiYugoslavianYumanYup'ikZimbabwean
Immigration
NonimmigrantsImmigrantsAfghanistanAfricaAlbaniaArgentinaArmeniaAsiaAustraliaAustriaBahamasBangladeshBarbadosBelarusBelgiumBelizeBoliviaBosnia and HerzegovinaBrazilBulgariaBurma/MyanmarCabo VerdeCambodiaCameroonCanadaCaribbeanCentral AmericaChileChinaColombiaCongoCosta RicaCroatiaCubaCzechoslovakiaDenmarkDominicaDominican RepublicEastern AfricaEastern AsiaEastern EuropeEcuadorEgyptEl SalvadorEnglandEritreaEthiopiaEuropeFijiFranceGermanyGhanaGreeceGrenadaGuatemalaGuyanaHaitiHondurasHong KongHungaryIndiaIndonesiaIranIraqIrelandItalyJamaicaJapanJordanKazakhstanKenyaKoreaKuwaitLaosLatin AmericaLatviaLebanonLiberiaLithuaniaMalaysiaMexicoMicronesiaMiddle AfricaMoldovaMoroccoNepalNetherlandsNicaraguaNigeriaNorth AmericaNorth MacedoniaNorthern AfricaNorthern EuropeNorwayOceaniaPakistanPanamaPeruPhilippinesPolandPortugalRomaniaRussiaSaudi ArabiaScotlandSenegalSerbiaSierra LeoneSingaporeSomaliaSouth AfricaSouth AmericaSouth Central AsiaSouth Eastern AsiaSouthern EuropeSpainSri LankaSt. Vincent and the GrenadinesSudanSwedenSwitzerlandSyriaTaiwanThailandTrinidad and TobagoTurkeyUgandaUkraineUruguayUzbekistanVenezuelaVietnamWest IndiesWestern AfricaWestern AsiaWestern EuropeYemenZaireZimbabweAzores
Median Household Income
Income
Poverty
Unemployment
Labor Participation
Family Structure
Vehicle Availability
Education Level
Disability

Median Household Income Comparison

Immigrants from Israel

Uruguayans

Exceptional
Average
$104,090
MEDIAN HOUSEHOLD INCOME
100.0/ 100
METRIC RATING
15th/ 347
METRIC RANK
$84,691
MEDIAN HOUSEHOLD INCOME
43.5/ 100
METRIC RATING
182nd/ 347
METRIC RANK

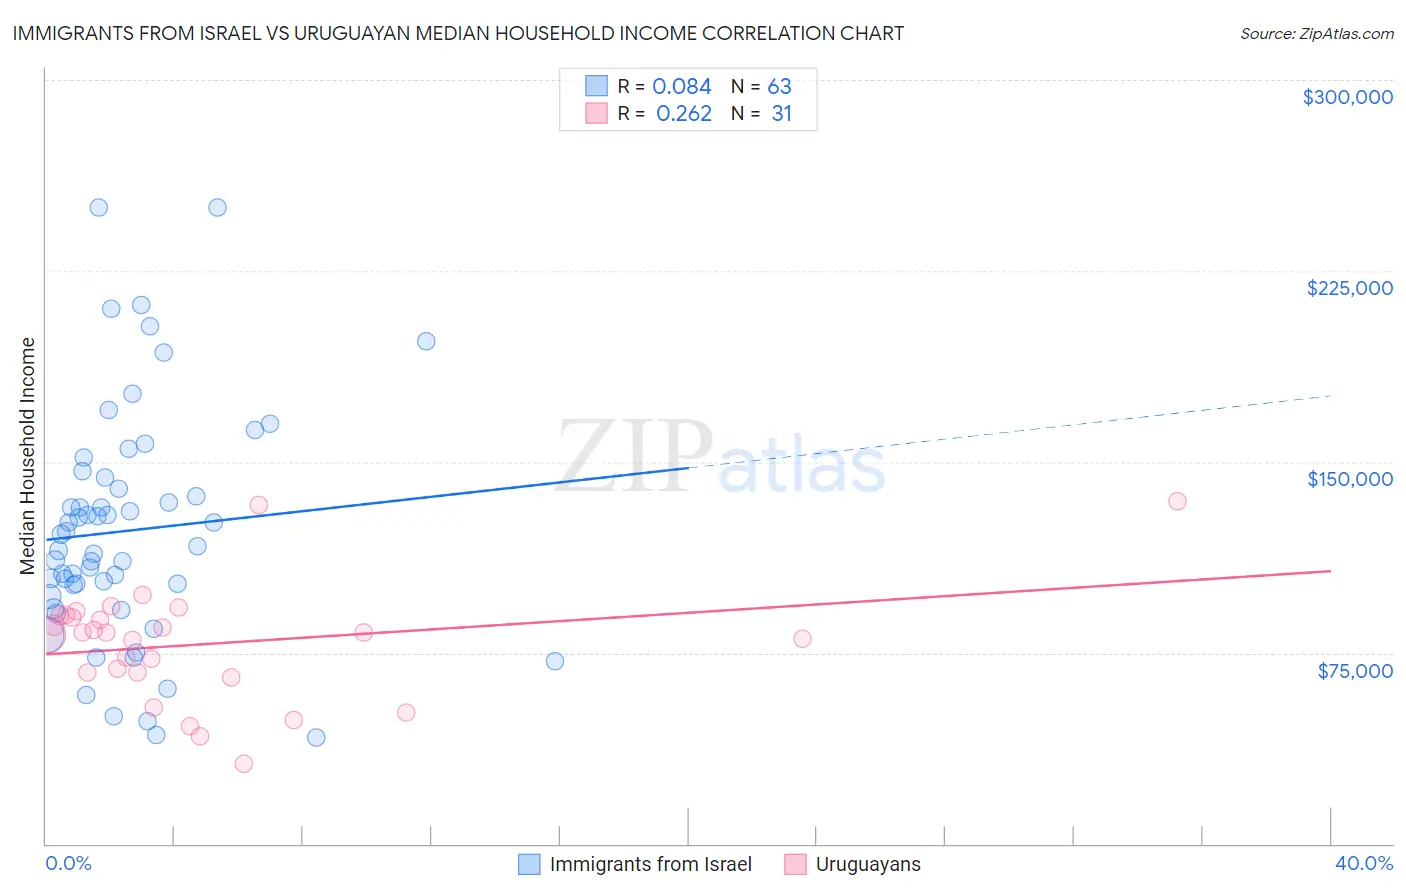
Immigrants from Israel vs Uruguayan Median Household Income Correlation Chart

The statistical analysis conducted on geographies consisting of 209,966,745 people shows a slight positive correlation between the proportion of Immigrants from Israel and median household income in the United States with a correlation coefficient (R) of 0.084 and weighted average of $104,090. Similarly, the statistical analysis conducted on geographies consisting of 144,748,959 people shows a weak positive correlation between the proportion of Uruguayans and median household income in the United States with a correlation coefficient (R) of 0.262 and weighted average of $84,691, a difference of 22.9%.
Immigrants from Israel vs Uruguayan Median Household Income

Median Household Income Correlation Summary

MeasurementImmigrants from IsraelUruguayan
Minimum$41,875$31,250
Maximum$250,001$134,635
Range$208,126$103,385
Mean$123,014$78,489
Median$116,644$82,857
Interquartile 25% (IQ1)$97,035$67,190
Interquartile 75% (IQ3)$143,680$89,740
Interquartile Range (IQR)$46,645$22,550
Standard Deviation (Sample)$45,941$22,490
Standard Deviation (Population)$45,575$22,125

Similar Demographics by Median Household Income

Demographics Similar to Immigrants from Israel by Median Household Income

In terms of median household income, the demographic groups most similar to Immigrants from Israel are Immigrants from Ireland ($104,692, a difference of 0.58%), Immigrants from Eastern Asia ($104,796, a difference of 0.68%), Burmese ($103,145, a difference of 0.92%), Immigrants from Korea ($102,962, a difference of 1.1%), and Indian (Asian) ($105,262, a difference of 1.1%).
DemographicsRating | RankMedian Household Income
Immigrants | Iran
100.0
/100
|
#8
Exceptional
$108,055
Okinawans
100.0
/100
|
#9
Exceptional
$106,624
Immigrants | South Central Asia
100.0
/100
|
#10
Exceptional
$106,057
Immigrants | China
100.0
/100
|
#11
Exceptional
$105,335
Indians (Asian)
100.0
/100
|
#12
Exceptional
$105,262
Immigrants | Eastern Asia
100.0
/100
|
#13
Exceptional
$104,796
Immigrants | Ireland
100.0
/100
|
#14
Exceptional
$104,692
Immigrants | Israel
100.0
/100
|
#15
Exceptional
$104,090
Burmese
100.0
/100
|
#16
Exceptional
$103,145
Immigrants | Korea
100.0
/100
|
#17
Exceptional
$102,962
Cypriots
100.0
/100
|
#18
Exceptional
$102,843
Immigrants | Australia
100.0
/100
|
#19
Exceptional
$102,562
Bolivians
100.0
/100
|
#20
Exceptional
$102,195
Eastern Europeans
100.0
/100
|
#21
Exceptional
$101,781
Asians
100.0
/100
|
#22
Exceptional
$101,681

Demographics Similar to Uruguayans by Median Household Income

In terms of median household income, the demographic groups most similar to Uruguayans are Hawaiian ($84,729, a difference of 0.040%), Immigrants from Portugal ($84,740, a difference of 0.060%), Spaniard ($84,644, a difference of 0.060%), English ($84,915, a difference of 0.26%), and Czechoslovakian ($84,965, a difference of 0.32%).
DemographicsRating | RankMedian Household Income
Immigrants | Costa Rica
49.2
/100
|
#175
Average
$85,054
Alsatians
49.2
/100
|
#176
Average
$85,053
Immigrants | Eritrea
48.8
/100
|
#177
Average
$85,025
Czechoslovakians
47.8
/100
|
#178
Average
$84,965
English
47.0
/100
|
#179
Average
$84,915
Immigrants | Portugal
44.2
/100
|
#180
Average
$84,740
Hawaiians
44.1
/100
|
#181
Average
$84,729
Uruguayans
43.5
/100
|
#182
Average
$84,691
Spaniards
42.7
/100
|
#183
Average
$84,644
Immigrants | Eastern Africa
37.4
/100
|
#184
Fair
$84,299
Kenyans
34.2
/100
|
#185
Fair
$84,085
Puget Sound Salish
33.2
/100
|
#186
Fair
$84,011
Belgians
33.2
/100
|
#187
Fair
$84,008
Tlingit-Haida
32.6
/100
|
#188
Fair
$83,968
Immigrants | Colombia
31.7
/100
|
#189
Fair
$83,902