Tsimshian vs Polish Per Capita Income
COMPARE
Tsimshian
Polish
Per Capita Income
Per Capita Income Comparison
Tsimshian
Poles
$40,344
PER CAPITA INCOME
2.4/ 100
METRIC RATING
239th/ 347
METRIC RANK
$46,123
PER CAPITA INCOME
94.1/ 100
METRIC RATING
116th/ 347
METRIC RANK
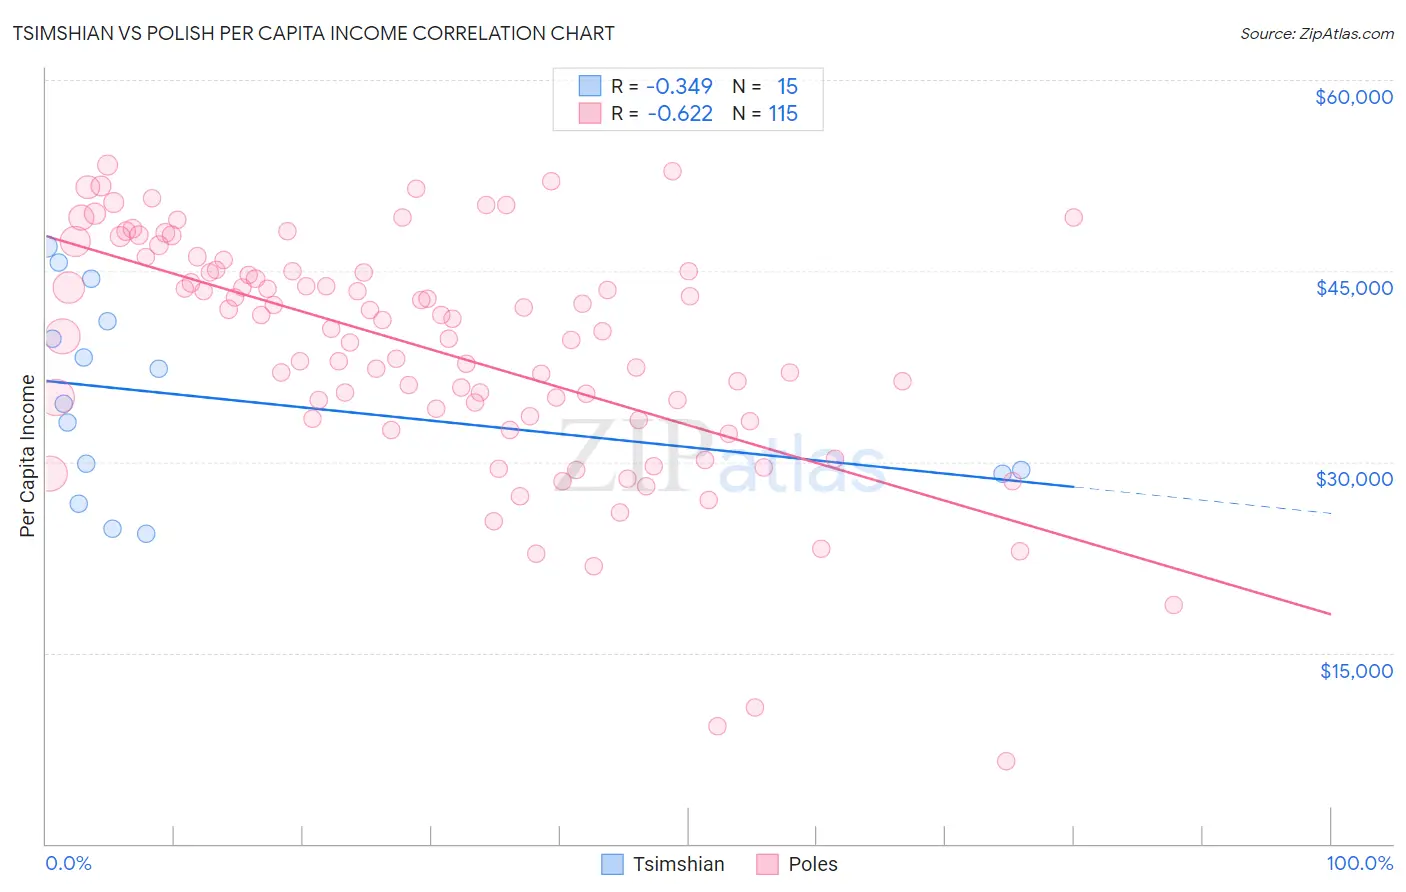
Tsimshian vs Polish Per Capita Income Correlation Chart
The statistical analysis conducted on geographies consisting of 15,626,544 people shows a mild negative correlation between the proportion of Tsimshian and per capita income in the United States with a correlation coefficient (R) of -0.349 and weighted average of $40,344. Similarly, the statistical analysis conducted on geographies consisting of 560,657,396 people shows a significant negative correlation between the proportion of Poles and per capita income in the United States with a correlation coefficient (R) of -0.622 and weighted average of $46,123, a difference of 14.3%.
Per Capita Income Correlation Summary
| Measurement | Tsimshian | Polish |
| Minimum | $24,381 | $6,461 |
| Maximum | $46,938 | $53,317 |
| Range | $22,557 | $46,856 |
| Mean | $35,015 | $38,750 |
| Median | $34,603 | $40,450 |
| Interquartile 25% (IQ1) | $29,100 | $33,437 |
| Interquartile 75% (IQ3) | $41,057 | $44,990 |
| Interquartile Range (IQR) | $11,957 | $11,553 |
| Standard Deviation (Sample) | $7,569 | $9,315 |
| Standard Deviation (Population) | $7,313 | $9,274 |
Similar Demographics by Per Capita Income
Demographics Similar to Tsimshian by Per Capita Income
In terms of per capita income, the demographic groups most similar to Tsimshian are Immigrants from Nigeria ($40,339, a difference of 0.010%), British West Indian ($40,330, a difference of 0.040%), Somali ($40,367, a difference of 0.060%), Immigrants from Western Africa ($40,294, a difference of 0.12%), and German Russian ($40,266, a difference of 0.19%).
| Demographics | Rating | Rank | Per Capita Income |
| Guyanese | 4.5 /100 | #232 | Tragic $40,949 |
| Delaware | 3.8 /100 | #233 | Tragic $40,778 |
| Immigrants | West Indies | 3.7 /100 | #234 | Tragic $40,763 |
| Immigrants | Guyana | 3.6 /100 | #235 | Tragic $40,742 |
| Immigrants | Nonimmigrants | 3.4 /100 | #236 | Tragic $40,669 |
| Immigrants | Cambodia | 2.6 /100 | #237 | Tragic $40,434 |
| Somalis | 2.4 /100 | #238 | Tragic $40,367 |
| Tsimshian | 2.4 /100 | #239 | Tragic $40,344 |
| Immigrants | Nigeria | 2.3 /100 | #240 | Tragic $40,339 |
| British West Indians | 2.3 /100 | #241 | Tragic $40,330 |
| Immigrants | Western Africa | 2.2 /100 | #242 | Tragic $40,294 |
| German Russians | 2.2 /100 | #243 | Tragic $40,266 |
| French American Indians | 2.1 /100 | #244 | Tragic $40,244 |
| Sub-Saharan Africans | 1.9 /100 | #245 | Tragic $40,152 |
| Cree | 1.7 /100 | #246 | Tragic $40,056 |
Demographics Similar to Poles by Per Capita Income
In terms of per capita income, the demographic groups most similar to Poles are Chinese ($46,098, a difference of 0.050%), Immigrants from Chile ($46,213, a difference of 0.20%), Immigrants from Saudi Arabia ($46,008, a difference of 0.25%), Immigrants from Poland ($45,979, a difference of 0.31%), and Afghan ($46,268, a difference of 0.32%).
| Demographics | Rating | Rank | Per Capita Income |
| Immigrants | Northern Africa | 96.2 /100 | #109 | Exceptional $46,531 |
| Chileans | 95.9 /100 | #110 | Exceptional $46,459 |
| Taiwanese | 95.8 /100 | #111 | Exceptional $46,455 |
| Immigrants | Morocco | 95.7 /100 | #112 | Exceptional $46,430 |
| Immigrants | Albania | 95.5 /100 | #113 | Exceptional $46,387 |
| Afghans | 94.9 /100 | #114 | Exceptional $46,268 |
| Immigrants | Chile | 94.6 /100 | #115 | Exceptional $46,213 |
| Poles | 94.1 /100 | #116 | Exceptional $46,123 |
| Chinese | 93.9 /100 | #117 | Exceptional $46,098 |
| Immigrants | Saudi Arabia | 93.3 /100 | #118 | Exceptional $46,008 |
| Immigrants | Poland | 93.1 /100 | #119 | Exceptional $45,979 |
| Immigrants | Ethiopia | 92.7 /100 | #120 | Exceptional $45,923 |
| Canadians | 92.2 /100 | #121 | Exceptional $45,858 |
| Moroccans | 92.1 /100 | #122 | Exceptional $45,854 |
| Lebanese | 92.0 /100 | #123 | Exceptional $45,840 |