Serbian vs Polish Per Capita Income
COMPARE
Serbian
Polish
Per Capita Income
Per Capita Income Comparison
Serbians
Poles
$46,551
PER CAPITA INCOME
96.2/ 100
METRIC RATING
107th/ 347
METRIC RANK
$46,123
PER CAPITA INCOME
94.1/ 100
METRIC RATING
116th/ 347
METRIC RANK
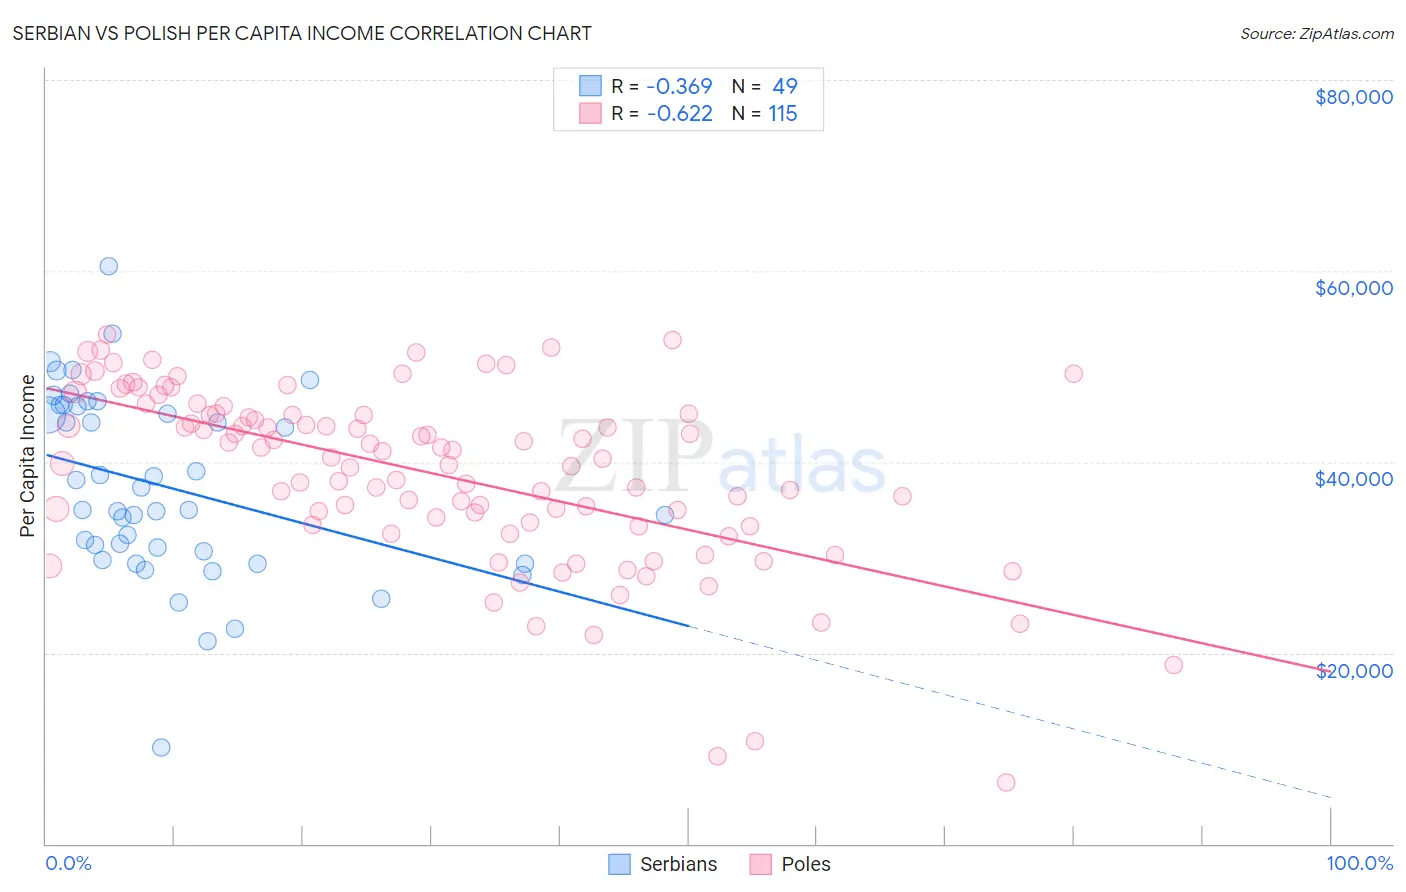
Serbian vs Polish Per Capita Income Correlation Chart
The statistical analysis conducted on geographies consisting of 267,655,306 people shows a mild negative correlation between the proportion of Serbians and per capita income in the United States with a correlation coefficient (R) of -0.369 and weighted average of $46,551. Similarly, the statistical analysis conducted on geographies consisting of 560,657,396 people shows a significant negative correlation between the proportion of Poles and per capita income in the United States with a correlation coefficient (R) of -0.622 and weighted average of $46,123, a difference of 0.93%.
Per Capita Income Correlation Summary
| Measurement | Serbian | Polish |
| Minimum | $10,108 | $6,461 |
| Maximum | $60,445 | $53,317 |
| Range | $50,337 | $46,856 |
| Mean | $37,423 | $38,750 |
| Median | $35,016 | $40,450 |
| Interquartile 25% (IQ1) | $30,161 | $33,437 |
| Interquartile 75% (IQ3) | $45,911 | $44,990 |
| Interquartile Range (IQR) | $15,749 | $11,553 |
| Standard Deviation (Sample) | $9,694 | $9,315 |
| Standard Deviation (Population) | $9,595 | $9,274 |
Demographics Similar to Serbians and Poles by Per Capita Income
In terms of per capita income, the demographic groups most similar to Serbians are Immigrants from Kuwait ($46,543, a difference of 0.020%), British ($46,571, a difference of 0.040%), Ethiopian ($46,569, a difference of 0.040%), Immigrants from Northern Africa ($46,531, a difference of 0.040%), and Chilean ($46,459, a difference of 0.20%). Similarly, the demographic groups most similar to Poles are Chinese ($46,098, a difference of 0.050%), Immigrants from Chile ($46,213, a difference of 0.20%), Immigrants from Saudi Arabia ($46,008, a difference of 0.25%), Immigrants from Poland ($45,979, a difference of 0.31%), and Afghan ($46,268, a difference of 0.32%).
| Demographics | Rating | Rank | Per Capita Income |
| Immigrants | Uzbekistan | 97.5 /100 | #101 | Exceptional $46,929 |
| Immigrants | Western Asia | 97.4 /100 | #102 | Exceptional $46,876 |
| Syrians | 97.2 /100 | #103 | Exceptional $46,837 |
| Brazilians | 96.8 /100 | #104 | Exceptional $46,700 |
| British | 96.3 /100 | #105 | Exceptional $46,571 |
| Ethiopians | 96.3 /100 | #106 | Exceptional $46,569 |
| Serbians | 96.2 /100 | #107 | Exceptional $46,551 |
| Immigrants | Kuwait | 96.2 /100 | #108 | Exceptional $46,543 |
| Immigrants | Northern Africa | 96.2 /100 | #109 | Exceptional $46,531 |
| Chileans | 95.9 /100 | #110 | Exceptional $46,459 |
| Taiwanese | 95.8 /100 | #111 | Exceptional $46,455 |
| Immigrants | Morocco | 95.7 /100 | #112 | Exceptional $46,430 |
| Immigrants | Albania | 95.5 /100 | #113 | Exceptional $46,387 |
| Afghans | 94.9 /100 | #114 | Exceptional $46,268 |
| Immigrants | Chile | 94.6 /100 | #115 | Exceptional $46,213 |
| Poles | 94.1 /100 | #116 | Exceptional $46,123 |
| Chinese | 93.9 /100 | #117 | Exceptional $46,098 |
| Immigrants | Saudi Arabia | 93.3 /100 | #118 | Exceptional $46,008 |
| Immigrants | Poland | 93.1 /100 | #119 | Exceptional $45,979 |
| Immigrants | Ethiopia | 92.7 /100 | #120 | Exceptional $45,923 |
| Canadians | 92.2 /100 | #121 | Exceptional $45,858 |