Icelander vs Macedonian Householder Income Ages 25 - 44 years
COMPARE
Icelander
Macedonian
Householder Income Ages 25 - 44 years
Householder Income Ages 25 - 44 years Comparison
Icelanders
Macedonians
$95,560
HOUSEHOLDER INCOME AGES 25 - 44 YEARS
63.4/ 100
METRIC RATING
160th/ 347
METRIC RANK
$101,882
HOUSEHOLDER INCOME AGES 25 - 44 YEARS
98.3/ 100
METRIC RATING
96th/ 347
METRIC RANK
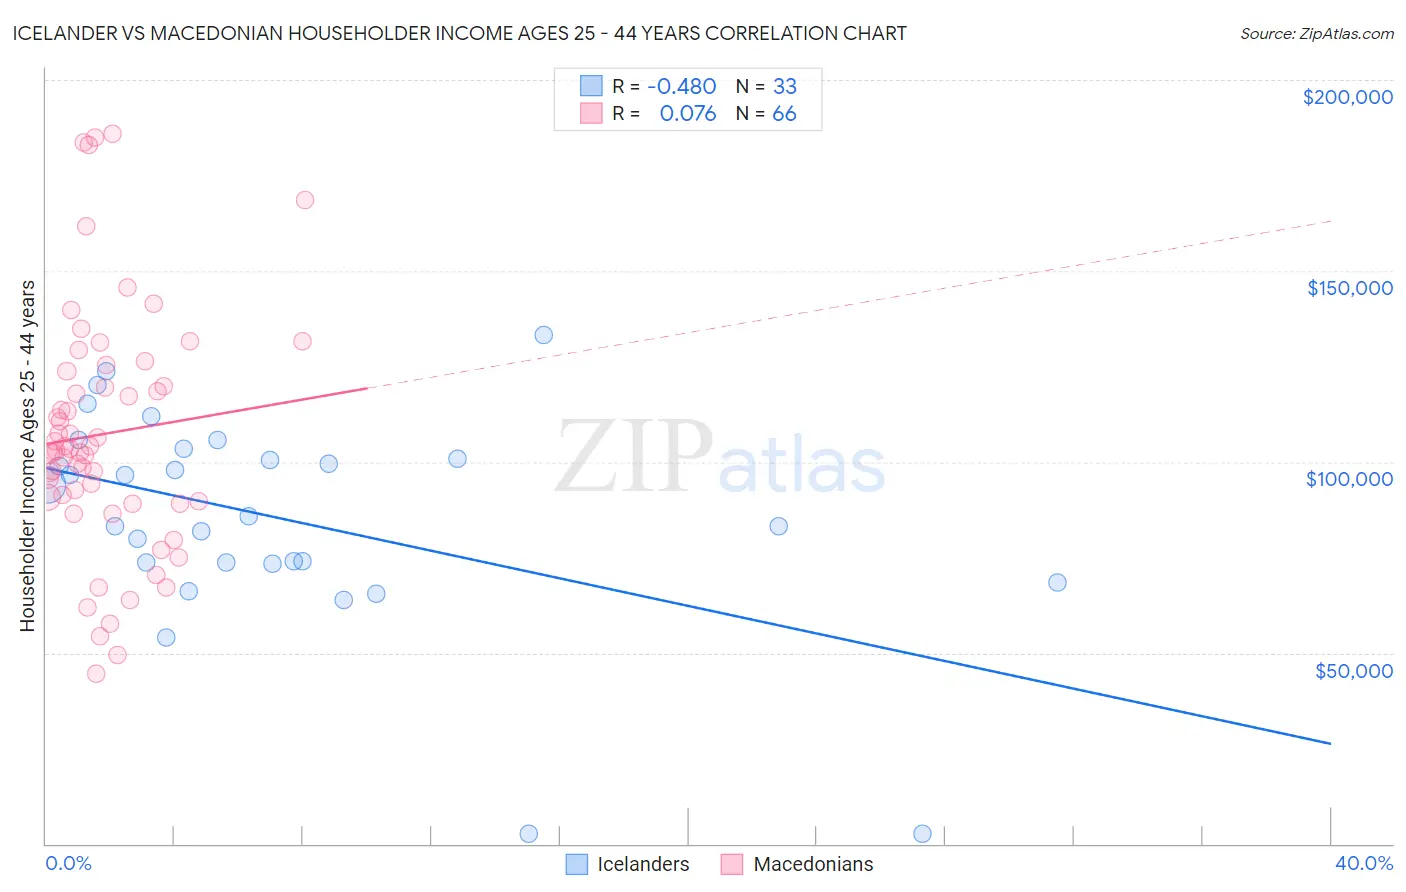
Icelander vs Macedonian Householder Income Ages 25 - 44 years Correlation Chart
The statistical analysis conducted on geographies consisting of 159,415,767 people shows a moderate negative correlation between the proportion of Icelanders and household income with householder between the ages 25 and 44 in the United States with a correlation coefficient (R) of -0.480 and weighted average of $95,560. Similarly, the statistical analysis conducted on geographies consisting of 132,531,102 people shows a slight positive correlation between the proportion of Macedonians and household income with householder between the ages 25 and 44 in the United States with a correlation coefficient (R) of 0.076 and weighted average of $101,882, a difference of 6.6%.
Householder Income Ages 25 - 44 years Correlation Summary
| Measurement | Icelander | Macedonian |
| Minimum | $2,499 | $44,379 |
| Maximum | $133,125 | $185,978 |
| Range | $130,626 | $141,599 |
| Mean | $85,123 | $107,344 |
| Median | $85,831 | $103,107 |
| Interquartile 25% (IQ1) | $73,462 | $89,835 |
| Interquartile 75% (IQ3) | $102,113 | $123,584 |
| Interquartile Range (IQR) | $28,651 | $33,749 |
| Standard Deviation (Sample) | $28,508 | $31,913 |
| Standard Deviation (Population) | $28,072 | $31,670 |
Similar Demographics by Householder Income Ages 25 - 44 years
Demographics Similar to Icelanders by Householder Income Ages 25 - 44 years
In terms of householder income ages 25 - 44 years, the demographic groups most similar to Icelanders are Costa Rican ($95,565, a difference of 0.010%), Scandinavian ($95,596, a difference of 0.040%), Immigrants from Portugal ($95,512, a difference of 0.050%), Swiss ($95,511, a difference of 0.050%), and Immigrants from Saudi Arabia ($95,450, a difference of 0.11%).
| Demographics | Rating | Rank | Householder Income Ages 25 - 44 years |
| Slovenes | 73.9 /100 | #153 | Good $96,439 |
| Slavs | 73.2 /100 | #154 | Good $96,377 |
| Moroccans | 70.3 /100 | #155 | Good $96,117 |
| Immigrants | Germany | 67.9 /100 | #156 | Good $95,913 |
| Immigrants | Uganda | 65.2 /100 | #157 | Good $95,698 |
| Scandinavians | 63.9 /100 | #158 | Good $95,596 |
| Costa Ricans | 63.5 /100 | #159 | Good $95,565 |
| Icelanders | 63.4 /100 | #160 | Good $95,560 |
| Immigrants | Portugal | 62.8 /100 | #161 | Good $95,512 |
| Swiss | 62.8 /100 | #162 | Good $95,511 |
| Immigrants | Saudi Arabia | 62.0 /100 | #163 | Good $95,450 |
| South Americans | 60.9 /100 | #164 | Good $95,362 |
| Immigrants | Nepal | 60.3 /100 | #165 | Good $95,322 |
| Immigrants | Ethiopia | 59.5 /100 | #166 | Average $95,256 |
| Czechoslovakians | 57.0 /100 | #167 | Average $95,070 |
Demographics Similar to Macedonians by Householder Income Ages 25 - 44 years
In terms of householder income ages 25 - 44 years, the demographic groups most similar to Macedonians are Austrian ($101,842, a difference of 0.040%), Assyrian/Chaldean/Syriac ($101,936, a difference of 0.050%), Sri Lankan ($101,960, a difference of 0.080%), Immigrants from England ($102,020, a difference of 0.14%), and Immigrants from Kazakhstan ($101,727, a difference of 0.15%).
| Demographics | Rating | Rank | Householder Income Ages 25 - 44 years |
| Romanians | 98.8 /100 | #89 | Exceptional $102,544 |
| Ukrainians | 98.8 /100 | #90 | Exceptional $102,451 |
| Croatians | 98.7 /100 | #91 | Exceptional $102,414 |
| Immigrants | North America | 98.7 /100 | #92 | Exceptional $102,407 |
| Immigrants | England | 98.4 /100 | #93 | Exceptional $102,020 |
| Sri Lankans | 98.4 /100 | #94 | Exceptional $101,960 |
| Assyrians/Chaldeans/Syriacs | 98.3 /100 | #95 | Exceptional $101,936 |
| Macedonians | 98.3 /100 | #96 | Exceptional $101,882 |
| Austrians | 98.3 /100 | #97 | Exceptional $101,842 |
| Immigrants | Kazakhstan | 98.1 /100 | #98 | Exceptional $101,727 |
| Taiwanese | 97.9 /100 | #99 | Exceptional $101,492 |
| Immigrants | Argentina | 97.8 /100 | #100 | Exceptional $101,415 |
| Albanians | 97.8 /100 | #101 | Exceptional $101,367 |
| Immigrants | Lebanon | 97.4 /100 | #102 | Exceptional $101,124 |
| Immigrants | Moldova | 97.4 /100 | #103 | Exceptional $101,091 |