Icelander vs Macedonian Householder Income Over 65 years
COMPARE
Icelander
Macedonian
Householder Income Over 65 years
Householder Income Over 65 years Comparison
Icelanders
Macedonians
$61,270
HOUSEHOLDER INCOME OVER 65 YEARS
57.9/ 100
METRIC RATING
161st/ 347
METRIC RANK
$61,564
HOUSEHOLDER INCOME OVER 65 YEARS
65.1/ 100
METRIC RATING
157th/ 347
METRIC RANK
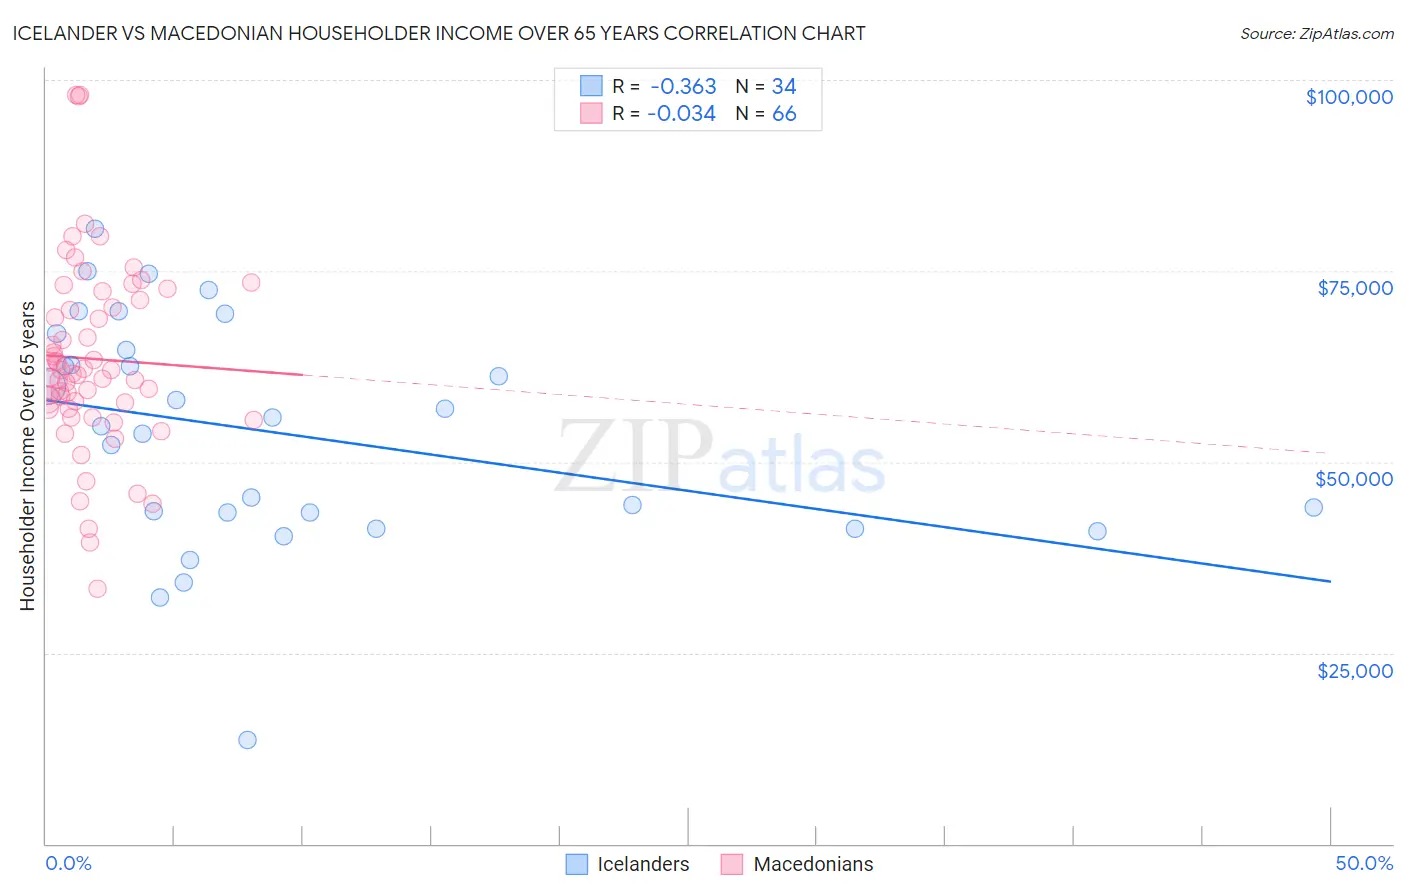
Icelander vs Macedonian Householder Income Over 65 years Correlation Chart
The statistical analysis conducted on geographies consisting of 159,443,752 people shows a mild negative correlation between the proportion of Icelanders and household income with householder over the age of 65 in the United States with a correlation coefficient (R) of -0.363 and weighted average of $61,270. Similarly, the statistical analysis conducted on geographies consisting of 132,472,355 people shows no correlation between the proportion of Macedonians and household income with householder over the age of 65 in the United States with a correlation coefficient (R) of -0.034 and weighted average of $61,564, a difference of 0.48%.
Householder Income Over 65 years Correlation Summary
| Measurement | Icelander | Macedonian |
| Minimum | $13,621 | $33,462 |
| Maximum | $80,499 | $98,027 |
| Range | $66,878 | $64,565 |
| Mean | $53,773 | $63,494 |
| Median | $55,258 | $61,728 |
| Interquartile 25% (IQ1) | $43,319 | $57,018 |
| Interquartile 75% (IQ3) | $64,676 | $71,201 |
| Interquartile Range (IQR) | $21,357 | $14,184 |
| Standard Deviation (Sample) | $14,894 | $12,480 |
| Standard Deviation (Population) | $14,674 | $12,385 |
Demographics Similar to Icelanders and Macedonians by Householder Income Over 65 years
In terms of householder income over 65 years, the demographic groups most similar to Icelanders are Czech ($61,244, a difference of 0.040%), Ugandan ($61,177, a difference of 0.15%), Immigrants from North Macedonia ($61,175, a difference of 0.16%), Immigrants from Ukraine ($61,163, a difference of 0.18%), and Immigrants from Eastern Africa ($61,157, a difference of 0.19%). Similarly, the demographic groups most similar to Macedonians are Scandinavian ($61,586, a difference of 0.040%), Polish ($61,598, a difference of 0.060%), Swiss ($61,621, a difference of 0.090%), Costa Rican ($61,638, a difference of 0.12%), and English ($61,487, a difference of 0.13%).
| Demographics | Rating | Rank | Householder Income Over 65 years |
| Scottish | 69.1 /100 | #149 | Good $61,735 |
| Slavs | 68.5 /100 | #150 | Good $61,709 |
| Hungarians | 67.7 /100 | #151 | Good $61,673 |
| Armenians | 67.3 /100 | #152 | Good $61,656 |
| Costa Ricans | 66.9 /100 | #153 | Good $61,638 |
| Swiss | 66.5 /100 | #154 | Good $61,621 |
| Poles | 65.9 /100 | #155 | Good $61,598 |
| Scandinavians | 65.6 /100 | #156 | Good $61,586 |
| Macedonians | 65.1 /100 | #157 | Good $61,564 |
| English | 63.3 /100 | #158 | Good $61,487 |
| Brazilians | 62.7 /100 | #159 | Good $61,465 |
| Portuguese | 62.1 /100 | #160 | Good $61,440 |
| Icelanders | 57.9 /100 | #161 | Average $61,270 |
| Czechs | 57.2 /100 | #162 | Average $61,244 |
| Ugandans | 55.5 /100 | #163 | Average $61,177 |
| Immigrants | North Macedonia | 55.4 /100 | #164 | Average $61,175 |
| Immigrants | Ukraine | 55.1 /100 | #165 | Average $61,163 |
| Immigrants | Eastern Africa | 55.0 /100 | #166 | Average $61,157 |
| Norwegians | 53.6 /100 | #167 | Average $61,104 |
| Irish | 53.4 /100 | #168 | Average $61,097 |
| Carpatho Rusyns | 53.3 /100 | #169 | Average $61,093 |