Black/African American vs Macedonian Householder Income Ages 25 - 44 years
COMPARE
Black/African American
Macedonian
Householder Income Ages 25 - 44 years
Householder Income Ages 25 - 44 years Comparison
Blacks/African Americans
Macedonians
$73,370
HOUSEHOLDER INCOME AGES 25 - 44 YEARS
0.0/ 100
METRIC RATING
337th/ 347
METRIC RANK
$101,882
HOUSEHOLDER INCOME AGES 25 - 44 YEARS
98.3/ 100
METRIC RATING
96th/ 347
METRIC RANK
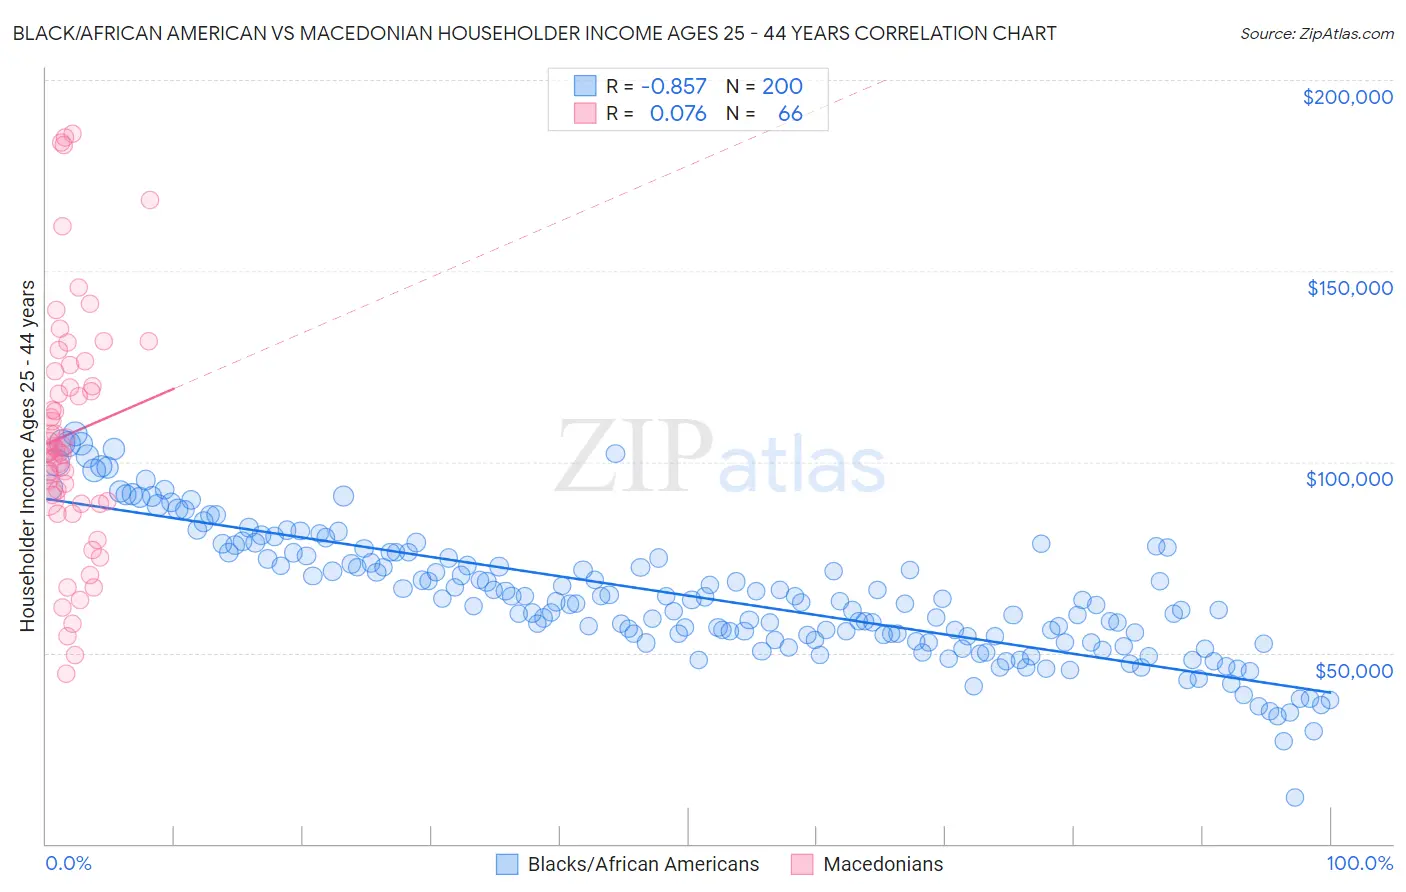
Black/African American vs Macedonian Householder Income Ages 25 - 44 years Correlation Chart
The statistical analysis conducted on geographies consisting of 560,674,363 people shows a very strong negative correlation between the proportion of Blacks/African Americans and household income with householder between the ages 25 and 44 in the United States with a correlation coefficient (R) of -0.857 and weighted average of $73,370. Similarly, the statistical analysis conducted on geographies consisting of 132,531,102 people shows a slight positive correlation between the proportion of Macedonians and household income with householder between the ages 25 and 44 in the United States with a correlation coefficient (R) of 0.076 and weighted average of $101,882, a difference of 38.9%.
Householder Income Ages 25 - 44 years Correlation Summary
| Measurement | Black/African American | Macedonian |
| Minimum | $12,048 | $44,379 |
| Maximum | $107,395 | $185,978 |
| Range | $95,347 | $141,599 |
| Mean | $64,936 | $107,344 |
| Median | $63,200 | $103,107 |
| Interquartile 25% (IQ1) | $53,277 | $89,835 |
| Interquartile 75% (IQ3) | $76,198 | $123,584 |
| Interquartile Range (IQR) | $22,921 | $33,749 |
| Standard Deviation (Sample) | $17,118 | $31,913 |
| Standard Deviation (Population) | $17,075 | $31,670 |
Similar Demographics by Householder Income Ages 25 - 44 years
Demographics Similar to Blacks/African Americans by Householder Income Ages 25 - 44 years
In terms of householder income ages 25 - 44 years, the demographic groups most similar to Blacks/African Americans are Yup'ik ($73,688, a difference of 0.43%), Immigrants from Yemen ($73,043, a difference of 0.45%), Yuman ($72,956, a difference of 0.57%), Immigrants from Congo ($72,178, a difference of 1.7%), and Kiowa ($74,776, a difference of 1.9%).
| Demographics | Rating | Rank | Householder Income Ages 25 - 44 years |
| Yakama | 0.0 /100 | #330 | Tragic $76,226 |
| Natives/Alaskans | 0.0 /100 | #331 | Tragic $75,647 |
| Bahamians | 0.0 /100 | #332 | Tragic $75,395 |
| Hopi | 0.0 /100 | #333 | Tragic $75,002 |
| Creek | 0.0 /100 | #334 | Tragic $74,847 |
| Kiowa | 0.0 /100 | #335 | Tragic $74,776 |
| Yup'ik | 0.0 /100 | #336 | Tragic $73,688 |
| Blacks/African Americans | 0.0 /100 | #337 | Tragic $73,370 |
| Immigrants | Yemen | 0.0 /100 | #338 | Tragic $73,043 |
| Yuman | 0.0 /100 | #339 | Tragic $72,956 |
| Immigrants | Congo | 0.0 /100 | #340 | Tragic $72,178 |
| Arapaho | 0.0 /100 | #341 | Tragic $71,697 |
| Crow | 0.0 /100 | #342 | Tragic $71,337 |
| Tohono O'odham | 0.0 /100 | #343 | Tragic $69,068 |
| Pueblo | 0.0 /100 | #344 | Tragic $68,910 |
Demographics Similar to Macedonians by Householder Income Ages 25 - 44 years
In terms of householder income ages 25 - 44 years, the demographic groups most similar to Macedonians are Austrian ($101,842, a difference of 0.040%), Assyrian/Chaldean/Syriac ($101,936, a difference of 0.050%), Sri Lankan ($101,960, a difference of 0.080%), Immigrants from England ($102,020, a difference of 0.14%), and Immigrants from Kazakhstan ($101,727, a difference of 0.15%).
| Demographics | Rating | Rank | Householder Income Ages 25 - 44 years |
| Romanians | 98.8 /100 | #89 | Exceptional $102,544 |
| Ukrainians | 98.8 /100 | #90 | Exceptional $102,451 |
| Croatians | 98.7 /100 | #91 | Exceptional $102,414 |
| Immigrants | North America | 98.7 /100 | #92 | Exceptional $102,407 |
| Immigrants | England | 98.4 /100 | #93 | Exceptional $102,020 |
| Sri Lankans | 98.4 /100 | #94 | Exceptional $101,960 |
| Assyrians/Chaldeans/Syriacs | 98.3 /100 | #95 | Exceptional $101,936 |
| Macedonians | 98.3 /100 | #96 | Exceptional $101,882 |
| Austrians | 98.3 /100 | #97 | Exceptional $101,842 |
| Immigrants | Kazakhstan | 98.1 /100 | #98 | Exceptional $101,727 |
| Taiwanese | 97.9 /100 | #99 | Exceptional $101,492 |
| Immigrants | Argentina | 97.8 /100 | #100 | Exceptional $101,415 |
| Albanians | 97.8 /100 | #101 | Exceptional $101,367 |
| Immigrants | Lebanon | 97.4 /100 | #102 | Exceptional $101,124 |
| Immigrants | Moldova | 97.4 /100 | #103 | Exceptional $101,091 |