Icelander vs Lithuanian Householder Income Ages 25 - 44 years
COMPARE
Icelander
Lithuanian
Householder Income Ages 25 - 44 years
Householder Income Ages 25 - 44 years Comparison
Icelanders
Lithuanians
$95,560
HOUSEHOLDER INCOME AGES 25 - 44 YEARS
63.4/ 100
METRIC RATING
160th/ 347
METRIC RANK
$105,223
HOUSEHOLDER INCOME AGES 25 - 44 YEARS
99.7/ 100
METRIC RATING
61st/ 347
METRIC RANK
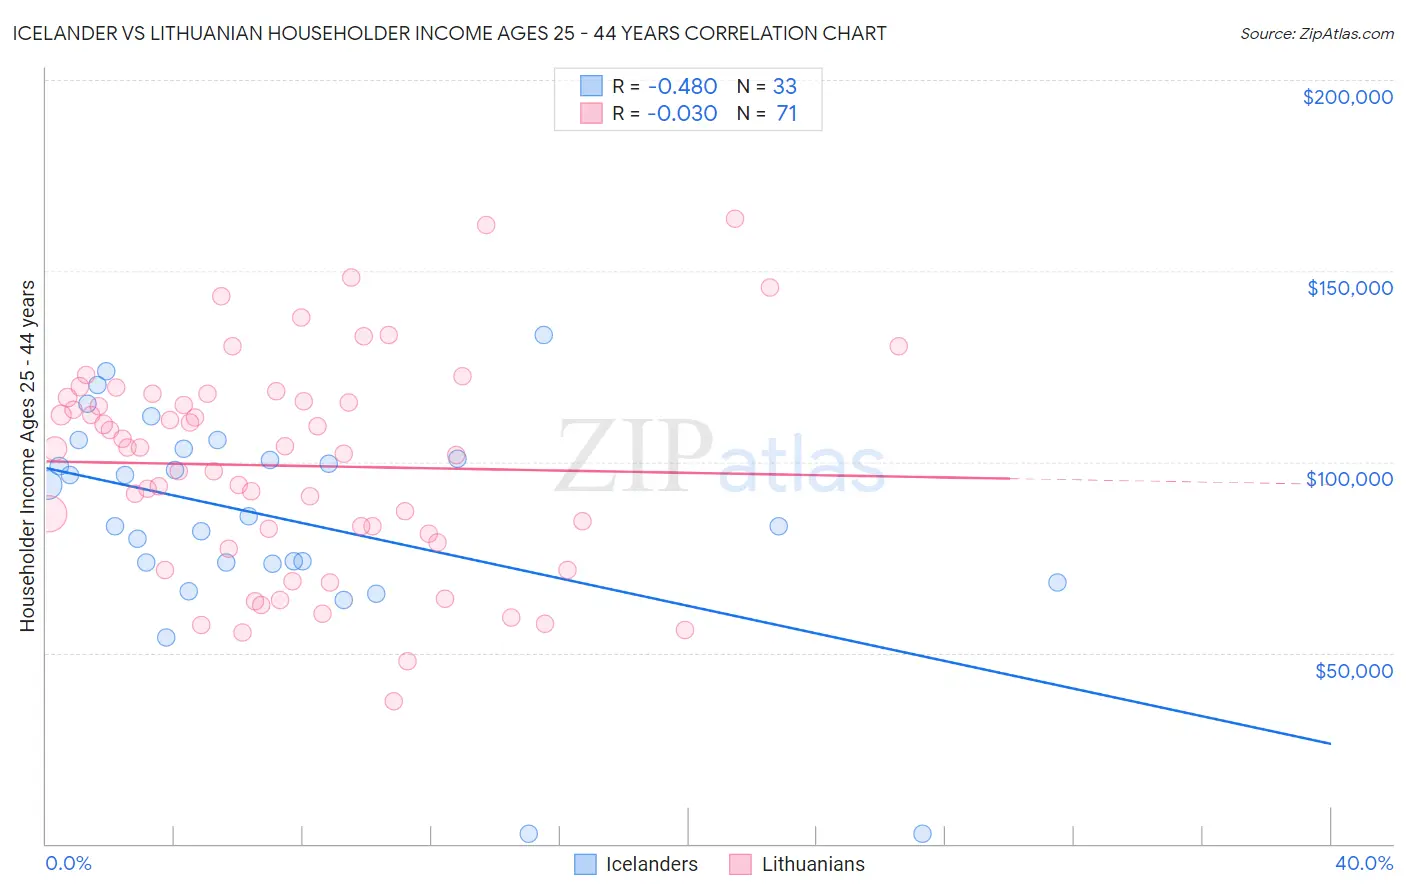
Icelander vs Lithuanian Householder Income Ages 25 - 44 years Correlation Chart
The statistical analysis conducted on geographies consisting of 159,415,767 people shows a moderate negative correlation between the proportion of Icelanders and household income with householder between the ages 25 and 44 in the United States with a correlation coefficient (R) of -0.480 and weighted average of $95,560. Similarly, the statistical analysis conducted on geographies consisting of 420,458,262 people shows no correlation between the proportion of Lithuanians and household income with householder between the ages 25 and 44 in the United States with a correlation coefficient (R) of -0.030 and weighted average of $105,223, a difference of 10.1%.
Householder Income Ages 25 - 44 years Correlation Summary
| Measurement | Icelander | Lithuanian |
| Minimum | $2,499 | $37,413 |
| Maximum | $133,125 | $163,542 |
| Range | $130,626 | $126,129 |
| Mean | $85,123 | $98,966 |
| Median | $85,831 | $103,489 |
| Interquartile 25% (IQ1) | $73,462 | $78,970 |
| Interquartile 75% (IQ3) | $102,113 | $116,848 |
| Interquartile Range (IQR) | $28,651 | $37,878 |
| Standard Deviation (Sample) | $28,508 | $27,829 |
| Standard Deviation (Population) | $28,072 | $27,632 |
Similar Demographics by Householder Income Ages 25 - 44 years
Demographics Similar to Icelanders by Householder Income Ages 25 - 44 years
In terms of householder income ages 25 - 44 years, the demographic groups most similar to Icelanders are Costa Rican ($95,565, a difference of 0.010%), Scandinavian ($95,596, a difference of 0.040%), Immigrants from Portugal ($95,512, a difference of 0.050%), Swiss ($95,511, a difference of 0.050%), and Immigrants from Saudi Arabia ($95,450, a difference of 0.11%).
| Demographics | Rating | Rank | Householder Income Ages 25 - 44 years |
| Slovenes | 73.9 /100 | #153 | Good $96,439 |
| Slavs | 73.2 /100 | #154 | Good $96,377 |
| Moroccans | 70.3 /100 | #155 | Good $96,117 |
| Immigrants | Germany | 67.9 /100 | #156 | Good $95,913 |
| Immigrants | Uganda | 65.2 /100 | #157 | Good $95,698 |
| Scandinavians | 63.9 /100 | #158 | Good $95,596 |
| Costa Ricans | 63.5 /100 | #159 | Good $95,565 |
| Icelanders | 63.4 /100 | #160 | Good $95,560 |
| Immigrants | Portugal | 62.8 /100 | #161 | Good $95,512 |
| Swiss | 62.8 /100 | #162 | Good $95,511 |
| Immigrants | Saudi Arabia | 62.0 /100 | #163 | Good $95,450 |
| South Americans | 60.9 /100 | #164 | Good $95,362 |
| Immigrants | Nepal | 60.3 /100 | #165 | Good $95,322 |
| Immigrants | Ethiopia | 59.5 /100 | #166 | Average $95,256 |
| Czechoslovakians | 57.0 /100 | #167 | Average $95,070 |
Demographics Similar to Lithuanians by Householder Income Ages 25 - 44 years
In terms of householder income ages 25 - 44 years, the demographic groups most similar to Lithuanians are Immigrants from Italy ($105,201, a difference of 0.020%), Egyptian ($105,282, a difference of 0.060%), Immigrants from Scotland ($105,089, a difference of 0.13%), New Zealander ($105,085, a difference of 0.13%), and Immigrants from Netherlands ($105,082, a difference of 0.13%).
| Demographics | Rating | Rank | Householder Income Ages 25 - 44 years |
| Paraguayans | 99.9 /100 | #54 | Exceptional $106,615 |
| Greeks | 99.9 /100 | #55 | Exceptional $106,457 |
| Immigrants | Pakistan | 99.8 /100 | #56 | Exceptional $106,129 |
| Immigrants | Austria | 99.8 /100 | #57 | Exceptional $106,103 |
| Immigrants | South Africa | 99.8 /100 | #58 | Exceptional $105,748 |
| Immigrants | Latvia | 99.8 /100 | #59 | Exceptional $105,522 |
| Egyptians | 99.7 /100 | #60 | Exceptional $105,282 |
| Lithuanians | 99.7 /100 | #61 | Exceptional $105,223 |
| Immigrants | Italy | 99.7 /100 | #62 | Exceptional $105,201 |
| Immigrants | Scotland | 99.7 /100 | #63 | Exceptional $105,089 |
| New Zealanders | 99.7 /100 | #64 | Exceptional $105,085 |
| Immigrants | Netherlands | 99.7 /100 | #65 | Exceptional $105,082 |
| Laotians | 99.7 /100 | #66 | Exceptional $104,993 |
| Immigrants | Romania | 99.6 /100 | #67 | Exceptional $104,713 |
| Immigrants | Eastern Europe | 99.6 /100 | #68 | Exceptional $104,662 |