Immigrants from Italy vs Macedonian Householder Income Ages 25 - 44 years
COMPARE
Immigrants from Italy
Macedonian
Householder Income Ages 25 - 44 years
Householder Income Ages 25 - 44 years Comparison
Immigrants from Italy
Macedonians
$105,201
HOUSEHOLDER INCOME AGES 25 - 44 YEARS
99.7/ 100
METRIC RATING
62nd/ 347
METRIC RANK
$101,882
HOUSEHOLDER INCOME AGES 25 - 44 YEARS
98.3/ 100
METRIC RATING
96th/ 347
METRIC RANK
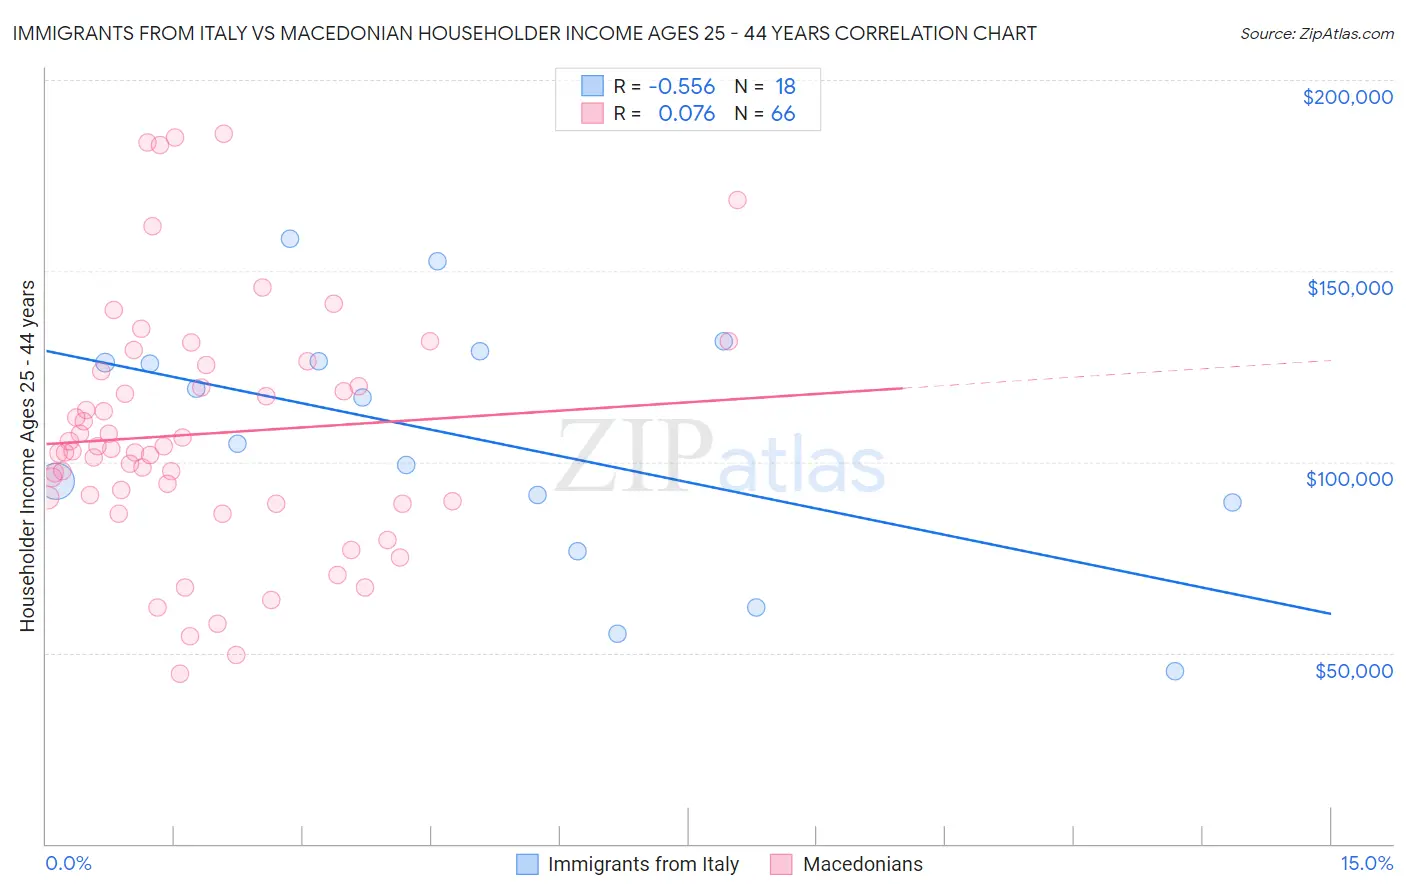
Immigrants from Italy vs Macedonian Householder Income Ages 25 - 44 years Correlation Chart
The statistical analysis conducted on geographies consisting of 323,420,404 people shows a substantial negative correlation between the proportion of Immigrants from Italy and household income with householder between the ages 25 and 44 in the United States with a correlation coefficient (R) of -0.556 and weighted average of $105,201. Similarly, the statistical analysis conducted on geographies consisting of 132,531,102 people shows a slight positive correlation between the proportion of Macedonians and household income with householder between the ages 25 and 44 in the United States with a correlation coefficient (R) of 0.076 and weighted average of $101,882, a difference of 3.3%.
Householder Income Ages 25 - 44 years Correlation Summary
| Measurement | Immigrants from Italy | Macedonian |
| Minimum | $45,256 | $44,379 |
| Maximum | $158,531 | $185,978 |
| Range | $113,275 | $141,599 |
| Mean | $105,762 | $107,344 |
| Median | $110,729 | $103,107 |
| Interquartile 25% (IQ1) | $89,375 | $89,835 |
| Interquartile 75% (IQ3) | $126,307 | $123,584 |
| Interquartile Range (IQR) | $36,932 | $33,749 |
| Standard Deviation (Sample) | $31,956 | $31,913 |
| Standard Deviation (Population) | $31,055 | $31,670 |
Similar Demographics by Householder Income Ages 25 - 44 years
Demographics Similar to Immigrants from Italy by Householder Income Ages 25 - 44 years
In terms of householder income ages 25 - 44 years, the demographic groups most similar to Immigrants from Italy are Lithuanian ($105,223, a difference of 0.020%), Egyptian ($105,282, a difference of 0.080%), Immigrants from Scotland ($105,089, a difference of 0.11%), New Zealander ($105,085, a difference of 0.11%), and Immigrants from Netherlands ($105,082, a difference of 0.11%).
| Demographics | Rating | Rank | Householder Income Ages 25 - 44 years |
| Greeks | 99.9 /100 | #55 | Exceptional $106,457 |
| Immigrants | Pakistan | 99.8 /100 | #56 | Exceptional $106,129 |
| Immigrants | Austria | 99.8 /100 | #57 | Exceptional $106,103 |
| Immigrants | South Africa | 99.8 /100 | #58 | Exceptional $105,748 |
| Immigrants | Latvia | 99.8 /100 | #59 | Exceptional $105,522 |
| Egyptians | 99.7 /100 | #60 | Exceptional $105,282 |
| Lithuanians | 99.7 /100 | #61 | Exceptional $105,223 |
| Immigrants | Italy | 99.7 /100 | #62 | Exceptional $105,201 |
| Immigrants | Scotland | 99.7 /100 | #63 | Exceptional $105,089 |
| New Zealanders | 99.7 /100 | #64 | Exceptional $105,085 |
| Immigrants | Netherlands | 99.7 /100 | #65 | Exceptional $105,082 |
| Laotians | 99.7 /100 | #66 | Exceptional $104,993 |
| Immigrants | Romania | 99.6 /100 | #67 | Exceptional $104,713 |
| Immigrants | Eastern Europe | 99.6 /100 | #68 | Exceptional $104,662 |
| Mongolians | 99.6 /100 | #69 | Exceptional $104,578 |
Demographics Similar to Macedonians by Householder Income Ages 25 - 44 years
In terms of householder income ages 25 - 44 years, the demographic groups most similar to Macedonians are Austrian ($101,842, a difference of 0.040%), Assyrian/Chaldean/Syriac ($101,936, a difference of 0.050%), Sri Lankan ($101,960, a difference of 0.080%), Immigrants from England ($102,020, a difference of 0.14%), and Immigrants from Kazakhstan ($101,727, a difference of 0.15%).
| Demographics | Rating | Rank | Householder Income Ages 25 - 44 years |
| Romanians | 98.8 /100 | #89 | Exceptional $102,544 |
| Ukrainians | 98.8 /100 | #90 | Exceptional $102,451 |
| Croatians | 98.7 /100 | #91 | Exceptional $102,414 |
| Immigrants | North America | 98.7 /100 | #92 | Exceptional $102,407 |
| Immigrants | England | 98.4 /100 | #93 | Exceptional $102,020 |
| Sri Lankans | 98.4 /100 | #94 | Exceptional $101,960 |
| Assyrians/Chaldeans/Syriacs | 98.3 /100 | #95 | Exceptional $101,936 |
| Macedonians | 98.3 /100 | #96 | Exceptional $101,882 |
| Austrians | 98.3 /100 | #97 | Exceptional $101,842 |
| Immigrants | Kazakhstan | 98.1 /100 | #98 | Exceptional $101,727 |
| Taiwanese | 97.9 /100 | #99 | Exceptional $101,492 |
| Immigrants | Argentina | 97.8 /100 | #100 | Exceptional $101,415 |
| Albanians | 97.8 /100 | #101 | Exceptional $101,367 |
| Immigrants | Lebanon | 97.4 /100 | #102 | Exceptional $101,124 |
| Immigrants | Moldova | 97.4 /100 | #103 | Exceptional $101,091 |