Icelander vs Spanish Householder Income Ages 25 - 44 years
COMPARE
Icelander
Spanish
Householder Income Ages 25 - 44 years
Householder Income Ages 25 - 44 years Comparison
Icelanders
Spanish
$95,560
HOUSEHOLDER INCOME AGES 25 - 44 YEARS
63.4/ 100
METRIC RATING
160th/ 347
METRIC RANK
$92,200
HOUSEHOLDER INCOME AGES 25 - 44 YEARS
21.2/ 100
METRIC RATING
197th/ 347
METRIC RANK
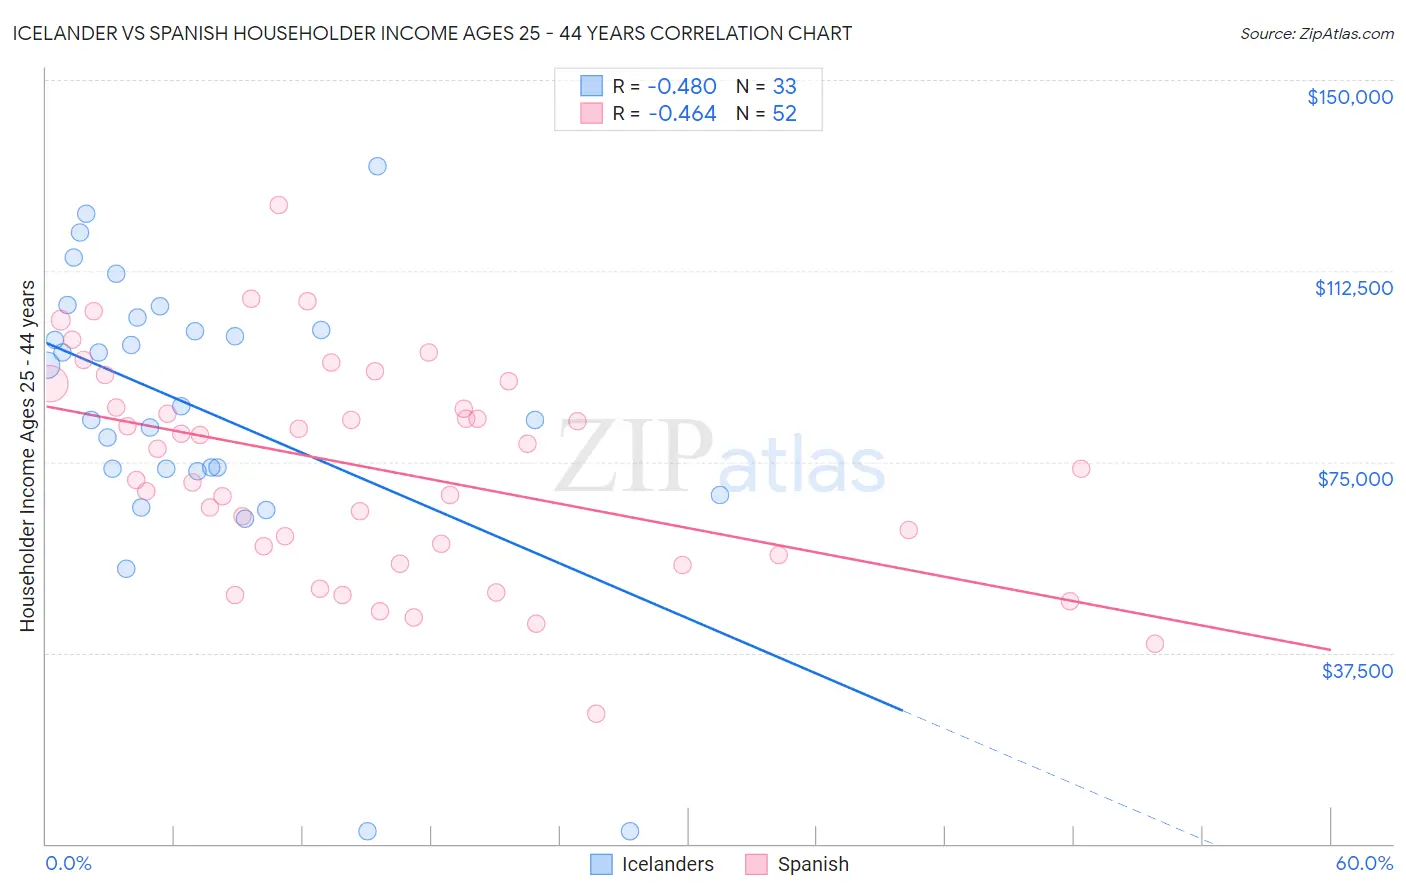
Icelander vs Spanish Householder Income Ages 25 - 44 years Correlation Chart
The statistical analysis conducted on geographies consisting of 159,415,767 people shows a moderate negative correlation between the proportion of Icelanders and household income with householder between the ages 25 and 44 in the United States with a correlation coefficient (R) of -0.480 and weighted average of $95,560. Similarly, the statistical analysis conducted on geographies consisting of 420,641,829 people shows a moderate negative correlation between the proportion of Spanish and household income with householder between the ages 25 and 44 in the United States with a correlation coefficient (R) of -0.464 and weighted average of $92,200, a difference of 3.6%.
Householder Income Ages 25 - 44 years Correlation Summary
| Measurement | Icelander | Spanish |
| Minimum | $2,499 | $25,625 |
| Maximum | $133,125 | $125,388 |
| Range | $130,626 | $99,763 |
| Mean | $85,123 | $73,721 |
| Median | $85,831 | $75,712 |
| Interquartile 25% (IQ1) | $73,462 | $57,541 |
| Interquartile 75% (IQ3) | $102,113 | $88,040 |
| Interquartile Range (IQR) | $28,651 | $30,499 |
| Standard Deviation (Sample) | $28,508 | $20,894 |
| Standard Deviation (Population) | $28,072 | $20,692 |
Similar Demographics by Householder Income Ages 25 - 44 years
Demographics Similar to Icelanders by Householder Income Ages 25 - 44 years
In terms of householder income ages 25 - 44 years, the demographic groups most similar to Icelanders are Costa Rican ($95,565, a difference of 0.010%), Scandinavian ($95,596, a difference of 0.040%), Immigrants from Portugal ($95,512, a difference of 0.050%), Swiss ($95,511, a difference of 0.050%), and Immigrants from Saudi Arabia ($95,450, a difference of 0.11%).
| Demographics | Rating | Rank | Householder Income Ages 25 - 44 years |
| Slovenes | 73.9 /100 | #153 | Good $96,439 |
| Slavs | 73.2 /100 | #154 | Good $96,377 |
| Moroccans | 70.3 /100 | #155 | Good $96,117 |
| Immigrants | Germany | 67.9 /100 | #156 | Good $95,913 |
| Immigrants | Uganda | 65.2 /100 | #157 | Good $95,698 |
| Scandinavians | 63.9 /100 | #158 | Good $95,596 |
| Costa Ricans | 63.5 /100 | #159 | Good $95,565 |
| Icelanders | 63.4 /100 | #160 | Good $95,560 |
| Immigrants | Portugal | 62.8 /100 | #161 | Good $95,512 |
| Swiss | 62.8 /100 | #162 | Good $95,511 |
| Immigrants | Saudi Arabia | 62.0 /100 | #163 | Good $95,450 |
| South Americans | 60.9 /100 | #164 | Good $95,362 |
| Immigrants | Nepal | 60.3 /100 | #165 | Good $95,322 |
| Immigrants | Ethiopia | 59.5 /100 | #166 | Average $95,256 |
| Czechoslovakians | 57.0 /100 | #167 | Average $95,070 |
Demographics Similar to Spanish by Householder Income Ages 25 - 44 years
In terms of householder income ages 25 - 44 years, the demographic groups most similar to Spanish are Immigrants from Colombia ($92,204, a difference of 0.0%), Celtic ($92,241, a difference of 0.040%), Vietnamese ($92,089, a difference of 0.12%), Immigrants from the Azores ($92,322, a difference of 0.13%), and Samoan ($92,385, a difference of 0.20%).
| Demographics | Rating | Rank | Householder Income Ages 25 - 44 years |
| Welsh | 30.0 /100 | #190 | Fair $93,039 |
| Tlingit-Haida | 29.4 /100 | #191 | Fair $92,987 |
| Immigrants | Costa Rica | 28.2 /100 | #192 | Fair $92,876 |
| Samoans | 23.0 /100 | #193 | Fair $92,385 |
| Immigrants | Azores | 22.4 /100 | #194 | Fair $92,322 |
| Celtics | 21.6 /100 | #195 | Fair $92,241 |
| Immigrants | Colombia | 21.3 /100 | #196 | Fair $92,204 |
| Spanish | 21.2 /100 | #197 | Fair $92,200 |
| Vietnamese | 20.2 /100 | #198 | Fair $92,089 |
| Kenyans | 16.8 /100 | #199 | Poor $91,684 |
| Whites/Caucasians | 16.7 /100 | #200 | Poor $91,668 |
| Japanese | 16.4 /100 | #201 | Poor $91,624 |
| Ecuadorians | 16.0 /100 | #202 | Poor $91,574 |
| Immigrants | Cambodia | 15.7 /100 | #203 | Poor $91,533 |
| Nepalese | 15.4 /100 | #204 | Poor $91,498 |