Icelander vs Immigrants from St. Vincent and the Grenadines Householder Income Ages 25 - 44 years
COMPARE
Icelander
Immigrants from St. Vincent and the Grenadines
Householder Income Ages 25 - 44 years
Householder Income Ages 25 - 44 years Comparison
Icelanders
Immigrants from St. Vincent and the Grenadines
$95,560
HOUSEHOLDER INCOME AGES 25 - 44 YEARS
63.4/ 100
METRIC RATING
160th/ 347
METRIC RANK
$88,888
HOUSEHOLDER INCOME AGES 25 - 44 YEARS
4.1/ 100
METRIC RATING
227th/ 347
METRIC RANK
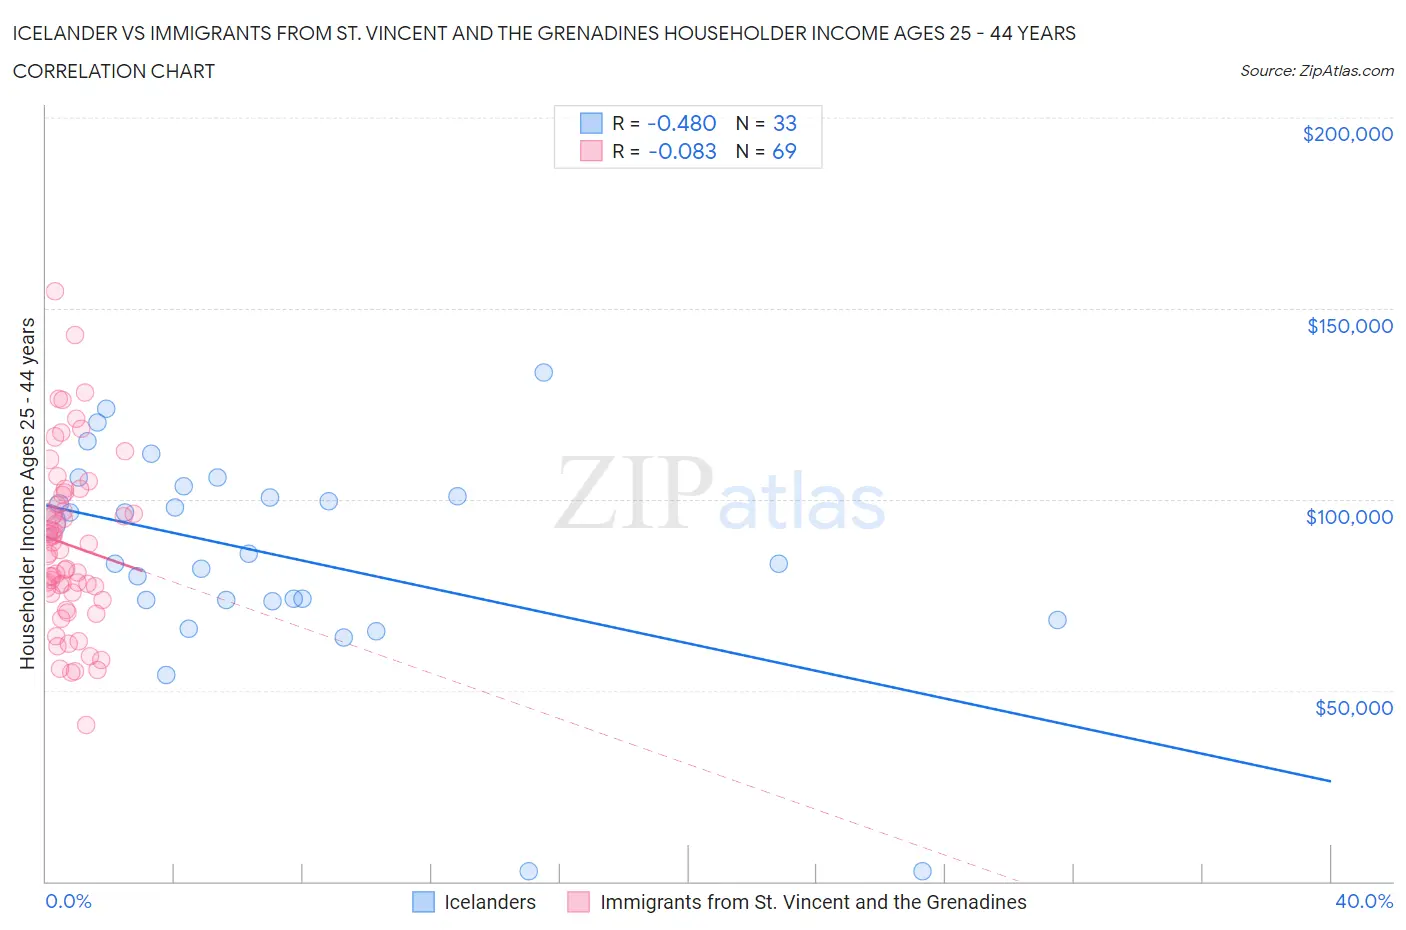
Icelander vs Immigrants from St. Vincent and the Grenadines Householder Income Ages 25 - 44 years Correlation Chart
The statistical analysis conducted on geographies consisting of 159,415,767 people shows a moderate negative correlation between the proportion of Icelanders and household income with householder between the ages 25 and 44 in the United States with a correlation coefficient (R) of -0.480 and weighted average of $95,560. Similarly, the statistical analysis conducted on geographies consisting of 56,178,565 people shows a slight negative correlation between the proportion of Immigrants from St. Vincent and the Grenadines and household income with householder between the ages 25 and 44 in the United States with a correlation coefficient (R) of -0.083 and weighted average of $88,888, a difference of 7.5%.
Householder Income Ages 25 - 44 years Correlation Summary
| Measurement | Icelander | Immigrants from St. Vincent and the Grenadines |
| Minimum | $2,499 | $40,942 |
| Maximum | $133,125 | $154,470 |
| Range | $130,626 | $113,528 |
| Mean | $85,123 | $88,106 |
| Median | $85,831 | $86,685 |
| Interquartile 25% (IQ1) | $73,462 | $75,335 |
| Interquartile 75% (IQ3) | $102,113 | $99,794 |
| Interquartile Range (IQR) | $28,651 | $24,459 |
| Standard Deviation (Sample) | $28,508 | $21,933 |
| Standard Deviation (Population) | $28,072 | $21,773 |
Similar Demographics by Householder Income Ages 25 - 44 years
Demographics Similar to Icelanders by Householder Income Ages 25 - 44 years
In terms of householder income ages 25 - 44 years, the demographic groups most similar to Icelanders are Costa Rican ($95,565, a difference of 0.010%), Scandinavian ($95,596, a difference of 0.040%), Immigrants from Portugal ($95,512, a difference of 0.050%), Swiss ($95,511, a difference of 0.050%), and Immigrants from Saudi Arabia ($95,450, a difference of 0.11%).
| Demographics | Rating | Rank | Householder Income Ages 25 - 44 years |
| Slovenes | 73.9 /100 | #153 | Good $96,439 |
| Slavs | 73.2 /100 | #154 | Good $96,377 |
| Moroccans | 70.3 /100 | #155 | Good $96,117 |
| Immigrants | Germany | 67.9 /100 | #156 | Good $95,913 |
| Immigrants | Uganda | 65.2 /100 | #157 | Good $95,698 |
| Scandinavians | 63.9 /100 | #158 | Good $95,596 |
| Costa Ricans | 63.5 /100 | #159 | Good $95,565 |
| Icelanders | 63.4 /100 | #160 | Good $95,560 |
| Immigrants | Portugal | 62.8 /100 | #161 | Good $95,512 |
| Swiss | 62.8 /100 | #162 | Good $95,511 |
| Immigrants | Saudi Arabia | 62.0 /100 | #163 | Good $95,450 |
| South Americans | 60.9 /100 | #164 | Good $95,362 |
| Immigrants | Nepal | 60.3 /100 | #165 | Good $95,322 |
| Immigrants | Ethiopia | 59.5 /100 | #166 | Average $95,256 |
| Czechoslovakians | 57.0 /100 | #167 | Average $95,070 |
Demographics Similar to Immigrants from St. Vincent and the Grenadines by Householder Income Ages 25 - 44 years
In terms of householder income ages 25 - 44 years, the demographic groups most similar to Immigrants from St. Vincent and the Grenadines are Immigrants from Bosnia and Herzegovina ($88,819, a difference of 0.080%), Immigrants from Barbados ($88,687, a difference of 0.23%), Alaskan Athabascan ($88,446, a difference of 0.50%), Immigrants from Iraq ($89,444, a difference of 0.62%), and Immigrants from Panama ($89,451, a difference of 0.63%).
| Demographics | Rating | Rank | Householder Income Ages 25 - 44 years |
| Trinidadians and Tobagonians | 6.8 /100 | #220 | Tragic $89,856 |
| Immigrants | Trinidad and Tobago | 6.5 /100 | #221 | Tragic $89,748 |
| Immigrants | Ecuador | 6.2 /100 | #222 | Tragic $89,673 |
| Immigrants | Guyana | 5.9 /100 | #223 | Tragic $89,586 |
| Barbadians | 5.9 /100 | #224 | Tragic $89,565 |
| Immigrants | Panama | 5.5 /100 | #225 | Tragic $89,451 |
| Immigrants | Iraq | 5.5 /100 | #226 | Tragic $89,444 |
| Immigrants | St. Vincent and the Grenadines | 4.1 /100 | #227 | Tragic $88,888 |
| Immigrants | Bosnia and Herzegovina | 4.0 /100 | #228 | Tragic $88,819 |
| Immigrants | Barbados | 3.7 /100 | #229 | Tragic $88,687 |
| Alaskan Athabascans | 3.3 /100 | #230 | Tragic $88,446 |
| Immigrants | Grenada | 3.0 /100 | #231 | Tragic $88,311 |
| Immigrants | Nonimmigrants | 3.0 /100 | #232 | Tragic $88,301 |
| Malaysians | 3.0 /100 | #233 | Tragic $88,291 |
| Venezuelans | 2.9 /100 | #234 | Tragic $88,232 |