Icelander vs Ethiopian Householder Income Ages 25 - 44 years
COMPARE
Icelander
Ethiopian
Householder Income Ages 25 - 44 years
Householder Income Ages 25 - 44 years Comparison
Icelanders
Ethiopians
$95,560
HOUSEHOLDER INCOME AGES 25 - 44 YEARS
63.4/ 100
METRIC RATING
160th/ 347
METRIC RANK
$96,824
HOUSEHOLDER INCOME AGES 25 - 44 YEARS
77.8/ 100
METRIC RATING
146th/ 347
METRIC RANK
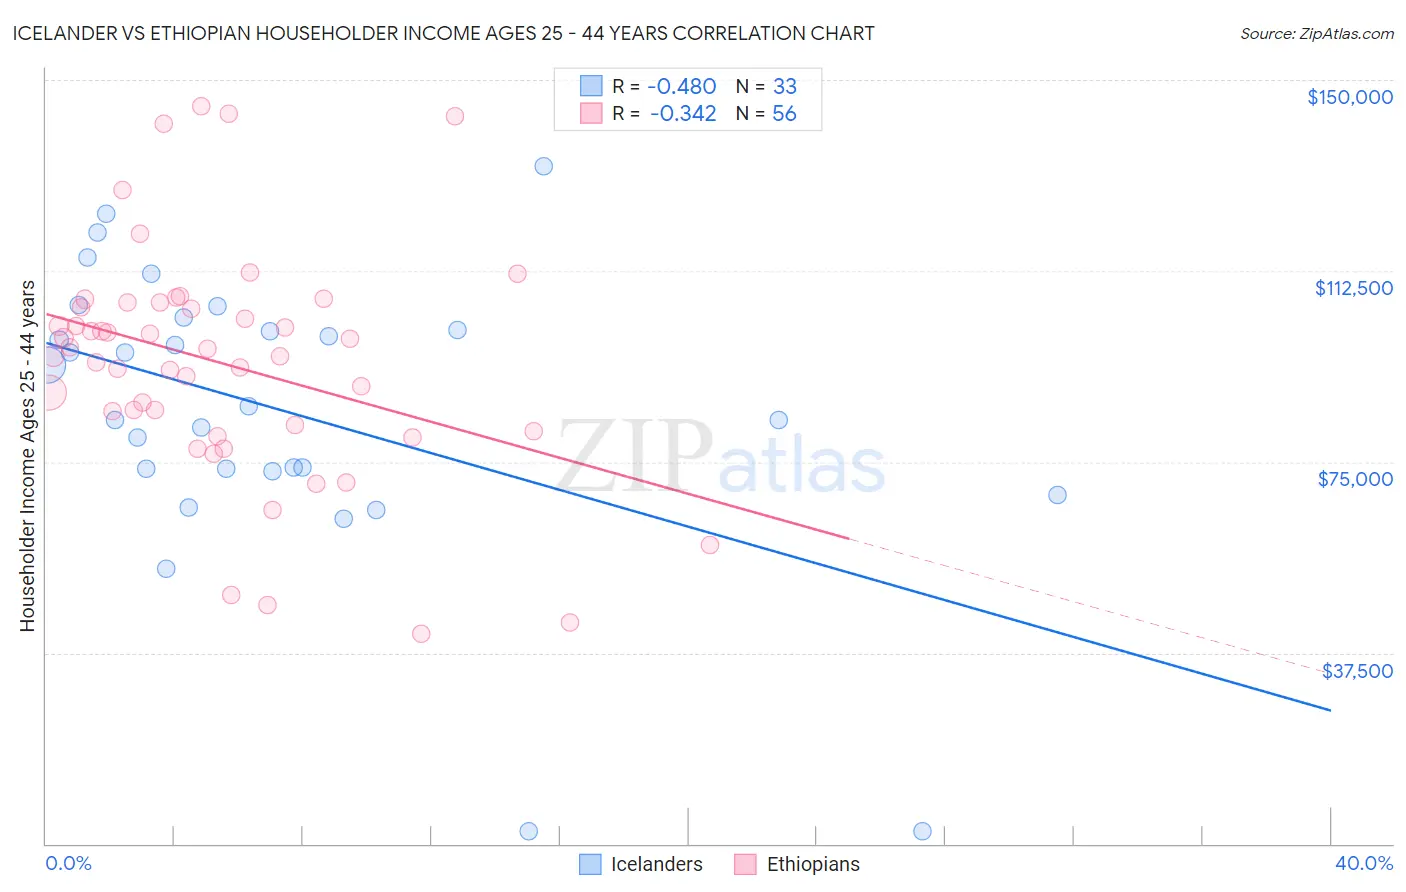
Icelander vs Ethiopian Householder Income Ages 25 - 44 years Correlation Chart
The statistical analysis conducted on geographies consisting of 159,415,767 people shows a moderate negative correlation between the proportion of Icelanders and household income with householder between the ages 25 and 44 in the United States with a correlation coefficient (R) of -0.480 and weighted average of $95,560. Similarly, the statistical analysis conducted on geographies consisting of 222,918,635 people shows a mild negative correlation between the proportion of Ethiopians and household income with householder between the ages 25 and 44 in the United States with a correlation coefficient (R) of -0.342 and weighted average of $96,824, a difference of 1.3%.
Householder Income Ages 25 - 44 years Correlation Summary
| Measurement | Icelander | Ethiopian |
| Minimum | $2,499 | $41,159 |
| Maximum | $133,125 | $144,957 |
| Range | $130,626 | $103,798 |
| Mean | $85,123 | $94,277 |
| Median | $85,831 | $96,491 |
| Interquartile 25% (IQ1) | $73,462 | $81,678 |
| Interquartile 75% (IQ3) | $102,113 | $105,834 |
| Interquartile Range (IQR) | $28,651 | $24,156 |
| Standard Deviation (Sample) | $28,508 | $22,788 |
| Standard Deviation (Population) | $28,072 | $22,583 |
Demographics Similar to Icelanders and Ethiopians by Householder Income Ages 25 - 44 years
In terms of householder income ages 25 - 44 years, the demographic groups most similar to Icelanders are Costa Rican ($95,565, a difference of 0.010%), Scandinavian ($95,596, a difference of 0.040%), Immigrants from Portugal ($95,512, a difference of 0.050%), Swiss ($95,511, a difference of 0.050%), and Immigrants from Saudi Arabia ($95,450, a difference of 0.11%). Similarly, the demographic groups most similar to Ethiopians are Norwegian ($96,866, a difference of 0.040%), Immigrants from Syria ($96,789, a difference of 0.040%), Irish ($96,730, a difference of 0.10%), Basque ($96,709, a difference of 0.12%), and Ugandan ($96,667, a difference of 0.16%).
| Demographics | Rating | Rank | Householder Income Ages 25 - 44 years |
| Immigrants | Jordan | 81.0 /100 | #143 | Excellent $97,185 |
| Immigrants | Chile | 80.8 /100 | #144 | Excellent $97,159 |
| Norwegians | 78.2 /100 | #145 | Good $96,866 |
| Ethiopians | 77.8 /100 | #146 | Good $96,824 |
| Immigrants | Syria | 77.4 /100 | #147 | Good $96,789 |
| Irish | 76.9 /100 | #148 | Good $96,730 |
| Basques | 76.6 /100 | #149 | Good $96,709 |
| Ugandans | 76.2 /100 | #150 | Good $96,667 |
| Czechs | 74.8 /100 | #151 | Good $96,525 |
| South American Indians | 74.5 /100 | #152 | Good $96,497 |
| Slovenes | 73.9 /100 | #153 | Good $96,439 |
| Slavs | 73.2 /100 | #154 | Good $96,377 |
| Moroccans | 70.3 /100 | #155 | Good $96,117 |
| Immigrants | Germany | 67.9 /100 | #156 | Good $95,913 |
| Immigrants | Uganda | 65.2 /100 | #157 | Good $95,698 |
| Scandinavians | 63.9 /100 | #158 | Good $95,596 |
| Costa Ricans | 63.5 /100 | #159 | Good $95,565 |
| Icelanders | 63.4 /100 | #160 | Good $95,560 |
| Immigrants | Portugal | 62.8 /100 | #161 | Good $95,512 |
| Swiss | 62.8 /100 | #162 | Good $95,511 |
| Immigrants | Saudi Arabia | 62.0 /100 | #163 | Good $95,450 |