Hungarian vs Immigrants from Philippines Unemployment Among Women with Children Under 6 years
COMPARE
Hungarian
Immigrants from Philippines
Unemployment Among Women with Children Under 6 years
Unemployment Among Women with Children Under 6 years Comparison
Hungarians
Immigrants from Philippines
7.8%
UNEMPLOYMENT AMONG WOMEN WITH CHILDREN UNDER 6 YEARS
21.2/ 100
METRIC RATING
206th/ 347
METRIC RANK
7.5%
UNEMPLOYMENT AMONG WOMEN WITH CHILDREN UNDER 6 YEARS
71.3/ 100
METRIC RATING
159th/ 347
METRIC RANK
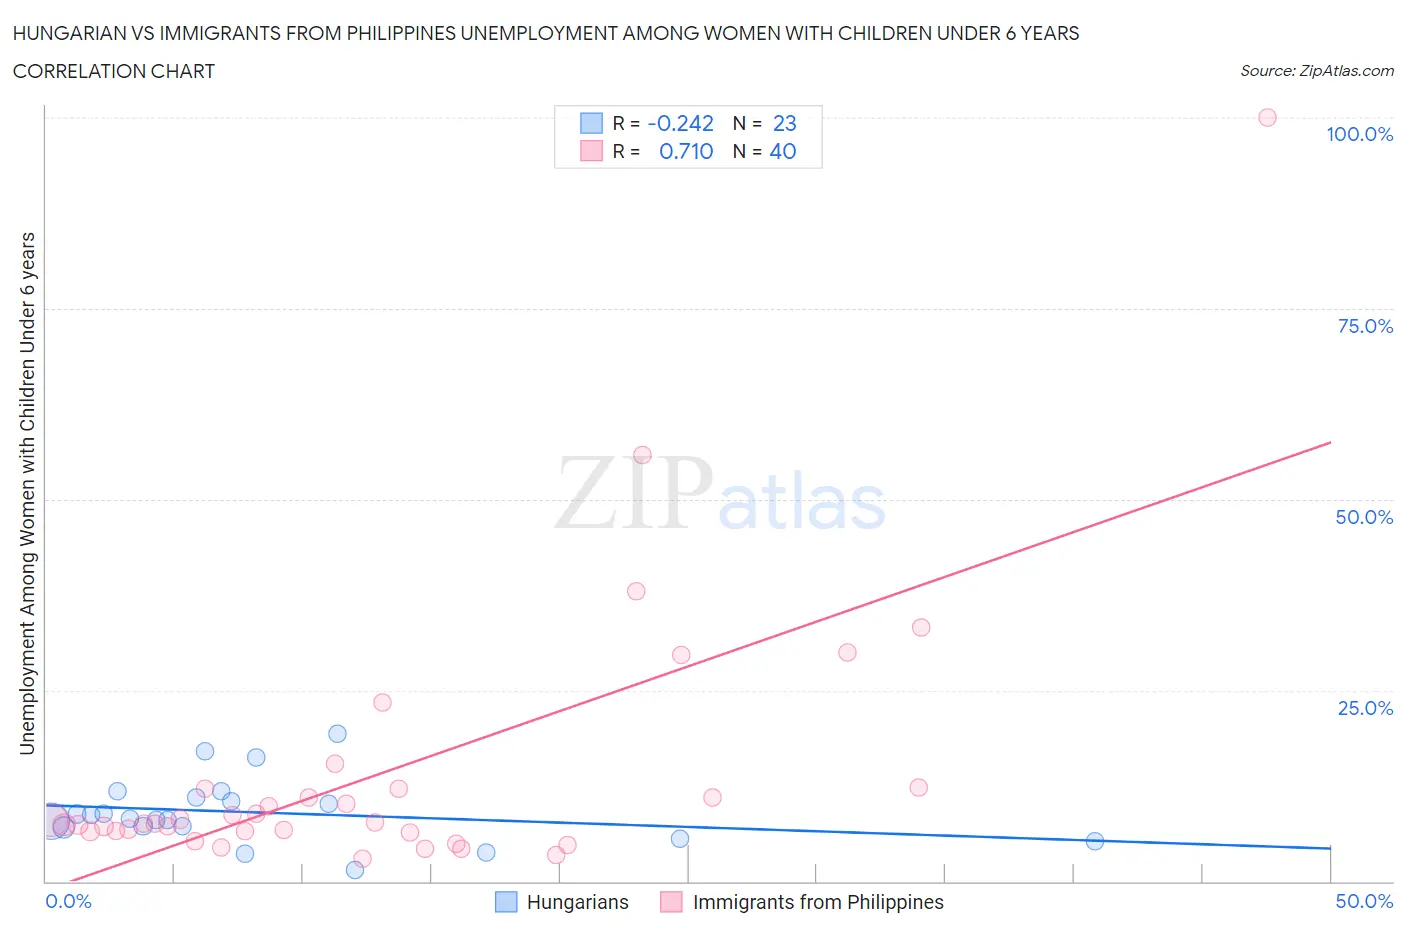
Hungarian vs Immigrants from Philippines Unemployment Among Women with Children Under 6 years Correlation Chart
The statistical analysis conducted on geographies consisting of 341,374,594 people shows a weak negative correlation between the proportion of Hungarians and unemployment rate among women with children under the age of 6 in the United States with a correlation coefficient (R) of -0.242 and weighted average of 7.8%. Similarly, the statistical analysis conducted on geographies consisting of 343,754,489 people shows a strong positive correlation between the proportion of Immigrants from Philippines and unemployment rate among women with children under the age of 6 in the United States with a correlation coefficient (R) of 0.710 and weighted average of 7.5%, a difference of 3.7%.
Unemployment Among Women with Children Under 6 years Correlation Summary
| Measurement | Hungarian | Immigrants from Philippines |
| Minimum | 1.5% | 3.0% |
| Maximum | 19.3% | 100.0% |
| Range | 17.8% | 97.0% |
| Mean | 9.0% | 14.1% |
| Median | 8.1% | 7.6% |
| Interquartile 25% (IQ1) | 7.1% | 6.5% |
| Interquartile 75% (IQ3) | 11.0% | 12.1% |
| Interquartile Range (IQR) | 3.9% | 5.5% |
| Standard Deviation (Sample) | 4.3% | 17.7% |
| Standard Deviation (Population) | 4.2% | 17.5% |
Similar Demographics by Unemployment Among Women with Children Under 6 years
Demographics Similar to Hungarians by Unemployment Among Women with Children Under 6 years
In terms of unemployment among women with children under 6 years, the demographic groups most similar to Hungarians are Immigrants (7.8%, a difference of 0.020%), Canadian (7.8%, a difference of 0.060%), Lebanese (7.8%, a difference of 0.10%), Spaniard (7.8%, a difference of 0.20%), and Sudanese (7.8%, a difference of 0.22%).
| Demographics | Rating | Rank | Unemployment Among Women with Children Under 6 years |
| Immigrants | Poland | 27.3 /100 | #199 | Fair 7.8% |
| Guamanians/Chamorros | 25.5 /100 | #200 | Fair 7.8% |
| Basques | 24.7 /100 | #201 | Fair 7.8% |
| Sudanese | 23.5 /100 | #202 | Fair 7.8% |
| Spaniards | 23.3 /100 | #203 | Fair 7.8% |
| Lebanese | 22.2 /100 | #204 | Fair 7.8% |
| Immigrants | Immigrants | 21.4 /100 | #205 | Fair 7.8% |
| Hungarians | 21.2 /100 | #206 | Fair 7.8% |
| Canadians | 20.6 /100 | #207 | Fair 7.8% |
| Immigrants | Syria | 18.9 /100 | #208 | Poor 7.8% |
| Costa Ricans | 17.6 /100 | #209 | Poor 7.8% |
| Poles | 16.0 /100 | #210 | Poor 7.9% |
| Immigrants | Ecuador | 14.9 /100 | #211 | Poor 7.9% |
| Swiss | 12.3 /100 | #212 | Poor 7.9% |
| Scottish | 11.4 /100 | #213 | Poor 7.9% |
Demographics Similar to Immigrants from Philippines by Unemployment Among Women with Children Under 6 years
In terms of unemployment among women with children under 6 years, the demographic groups most similar to Immigrants from Philippines are Bolivian (7.5%, a difference of 0.040%), Croatian (7.5%, a difference of 0.050%), Peruvian (7.5%, a difference of 0.080%), Immigrants from Western Asia (7.5%, a difference of 0.080%), and Immigrants from Southern Europe (7.5%, a difference of 0.17%).
| Demographics | Rating | Rank | Unemployment Among Women with Children Under 6 years |
| Bangladeshis | 74.8 /100 | #152 | Good 7.5% |
| Uruguayans | 74.7 /100 | #153 | Good 7.5% |
| Northern Europeans | 74.3 /100 | #154 | Good 7.5% |
| South Americans | 74.1 /100 | #155 | Good 7.5% |
| Immigrants | Southern Europe | 73.2 /100 | #156 | Good 7.5% |
| Peruvians | 72.3 /100 | #157 | Good 7.5% |
| Croatians | 71.9 /100 | #158 | Good 7.5% |
| Immigrants | Philippines | 71.3 /100 | #159 | Good 7.5% |
| Bolivians | 70.8 /100 | #160 | Good 7.5% |
| Immigrants | Western Asia | 70.2 /100 | #161 | Good 7.5% |
| Immigrants | Lithuania | 68.8 /100 | #162 | Good 7.5% |
| British | 66.3 /100 | #163 | Good 7.6% |
| Ugandans | 65.8 /100 | #164 | Good 7.6% |
| Immigrants | South America | 65.6 /100 | #165 | Good 7.6% |
| Belgians | 63.5 /100 | #166 | Good 7.6% |